Recently I added response time to my apache logs, to keep track of how long the server response took.
To do that, in your apache config apache2.conf, add %D:
LogFormat "%v:%p %h %l %u %t \"%r\" %>s %O \"%{Referer}i\" \"%{User-Agent}i\" %D" vhost_combined
# Added response time %D
LogFormat "%h %l %u %t \"%r\" %>s %O \"%{Referer}i\" \"%{User-Agent}i\" %D" combined
Now about 7 days after implementing this I updated the PHP version on the server to php 7.3.
Getting Logs
I copied the logs to a folder with (all those after the 17th of October):
find . -type f -newermt 2019-10-17 | xargs cp -t /home/stephen/response_time/Now that I have the logs, what I want to do is unzip them and aggregate them all into a single pandas dataframe.
Creating the Dataframe
Just get the damn data it doesn’t need to be pretty:
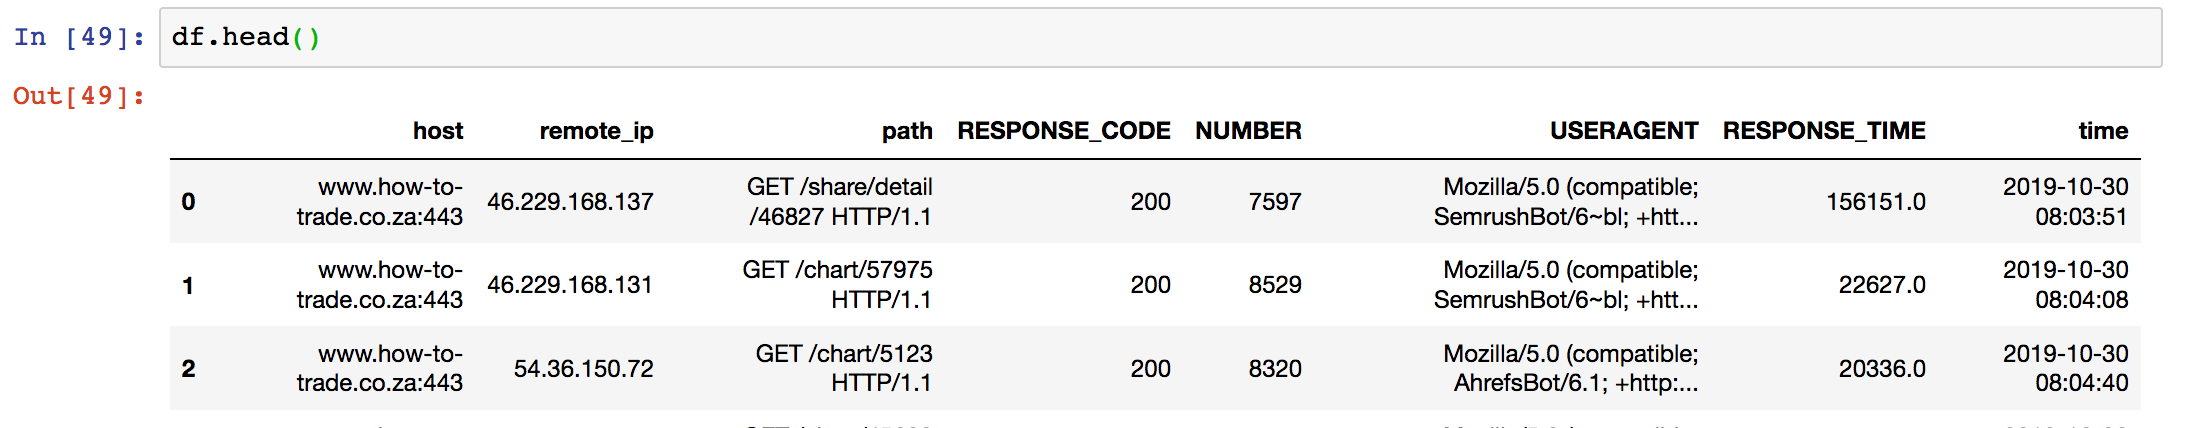
Example of a log entry:
# www.how-to-trade.co.za:443 105.226.233.14 - - [30/Oct/2019:16:27:11 +0200] "GET /feed/history?symbol=IMP&resolution=D&from=1571581631&to=1572445631 HTTP/1.1" 200 709 "https://how-to-trade.co.za/chart/view" "Mozilla/5.0 (Windows NT 10.0; WOW64; Trident/7.0; rv:11.0) like Gecko" 35959
I then setup:
fields = ['host', 'remote_ip', 'A', 'B', 'date_1', 'timezone',
'path', 'RESPONSE_CODE', 'NUMBER', 'unknown', 'USERAGENT', 'RESPONSE_TIME']

df = pd.DataFrame()
for i in range(15):
data = pd.read_csv('how-to-trade-access.log.{0}.gz'.format(i), compression='gzip', sep=' ', header=None, names=fields, na_values=['-'])

time = data.date_1 + data.timezone
time_trimmed = time.map(lambda s: s.strip('[]').split('-')[0].split('+')[0]) # Drop the timezone for simplicity
data['time'] = pd.to_datetime(time_trimmed, format='%d/%b/%Y:%H:%M:%S')

data = data.drop(columns=['date_1', 'timezone', 'A', 'B', 'unknown'])

df = pd.concat([df, data])
So now we have a nice data frame…
Basic Data Analysis
So we are just looking at the how-to-trade.co.za site.
Number of rows: 211388
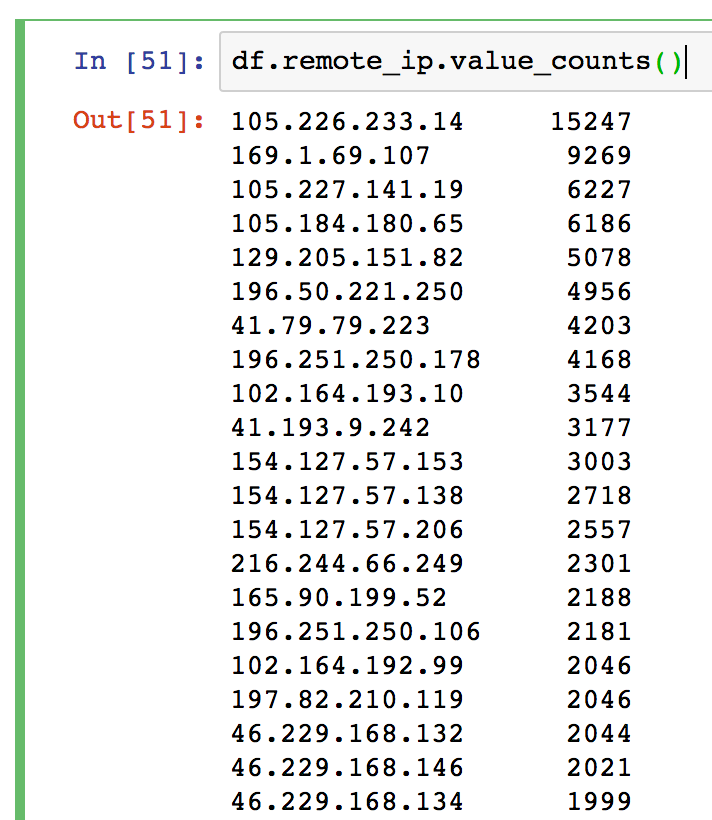
Most frequent IPs
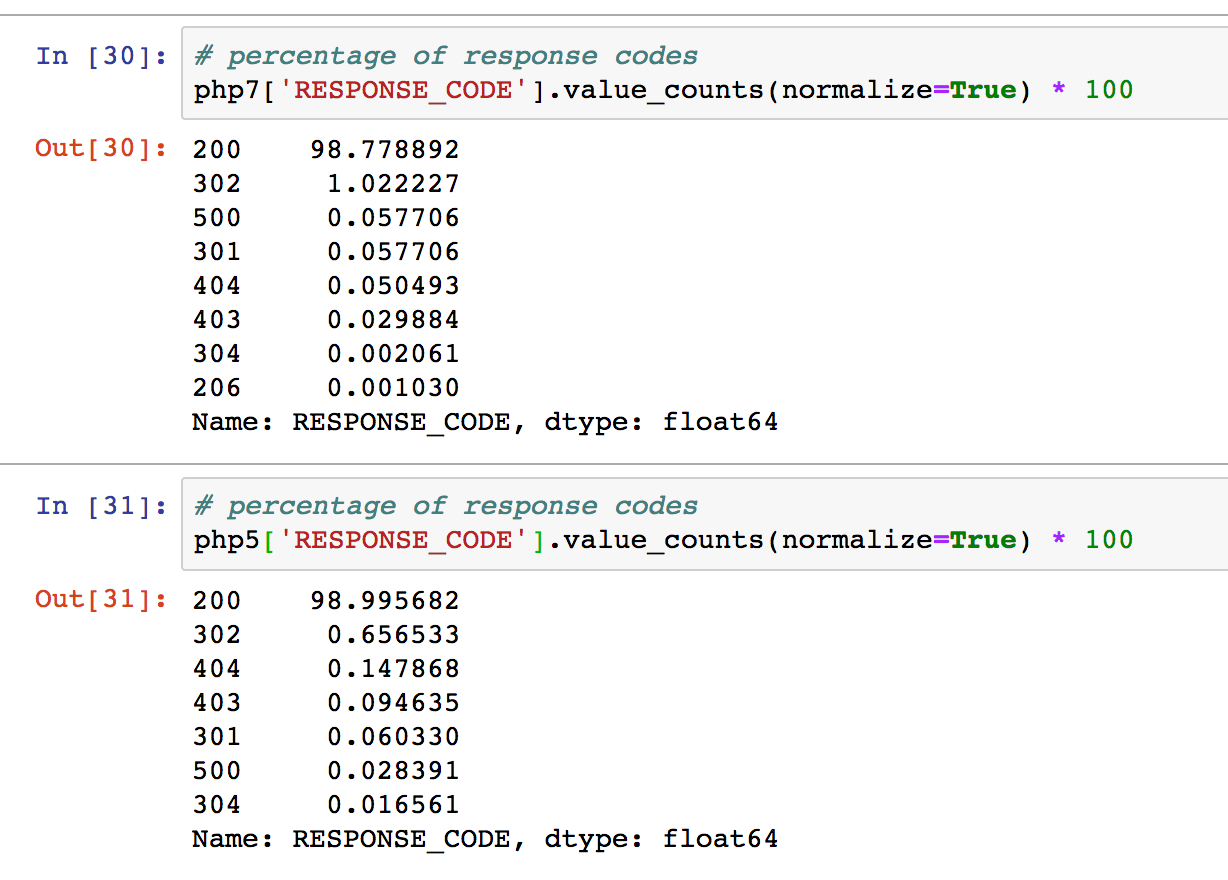
Most Common Response Codes
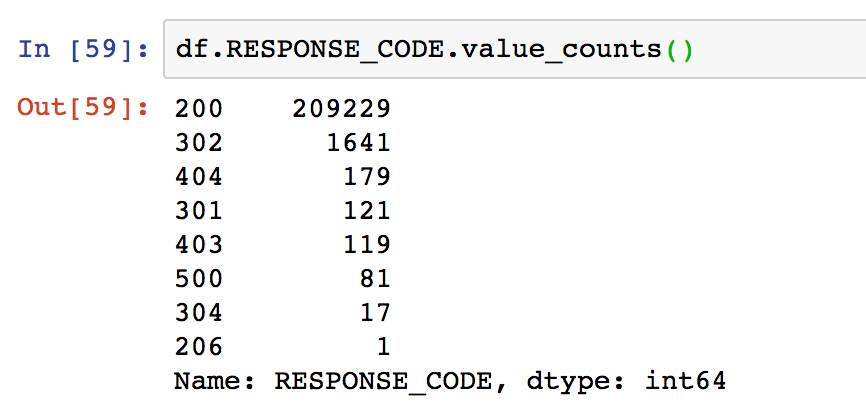
Interesting is the one 206 Partial Content.
304 Not modified, the 500 internal server errors need to be looked into. The rest are pretty standard.
UserAgents
Checking the top 5 useragents, it seems that semrush is an abuser.
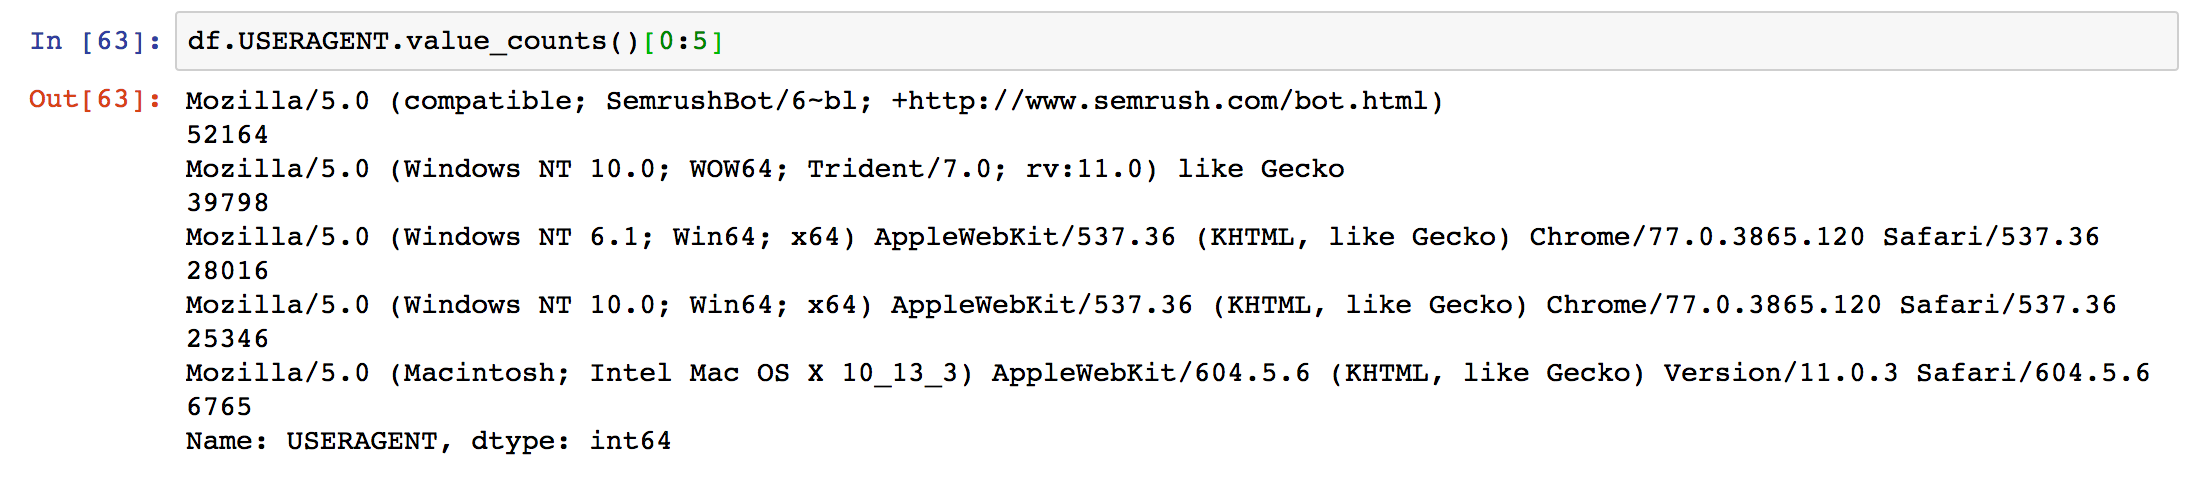
Very important that I add this to my robots.txt
Number of Responses per Day
 It would be nice if I could put a percentage here and also a day of the week so I can make some calls.
I made the change on 17 October, so I need to drop all rows that don’t have a response time.
I then changed to PHP7.3 on 23 October 2019.
I then got the logs today.
So let me get an average of the response times (in milliseconds).
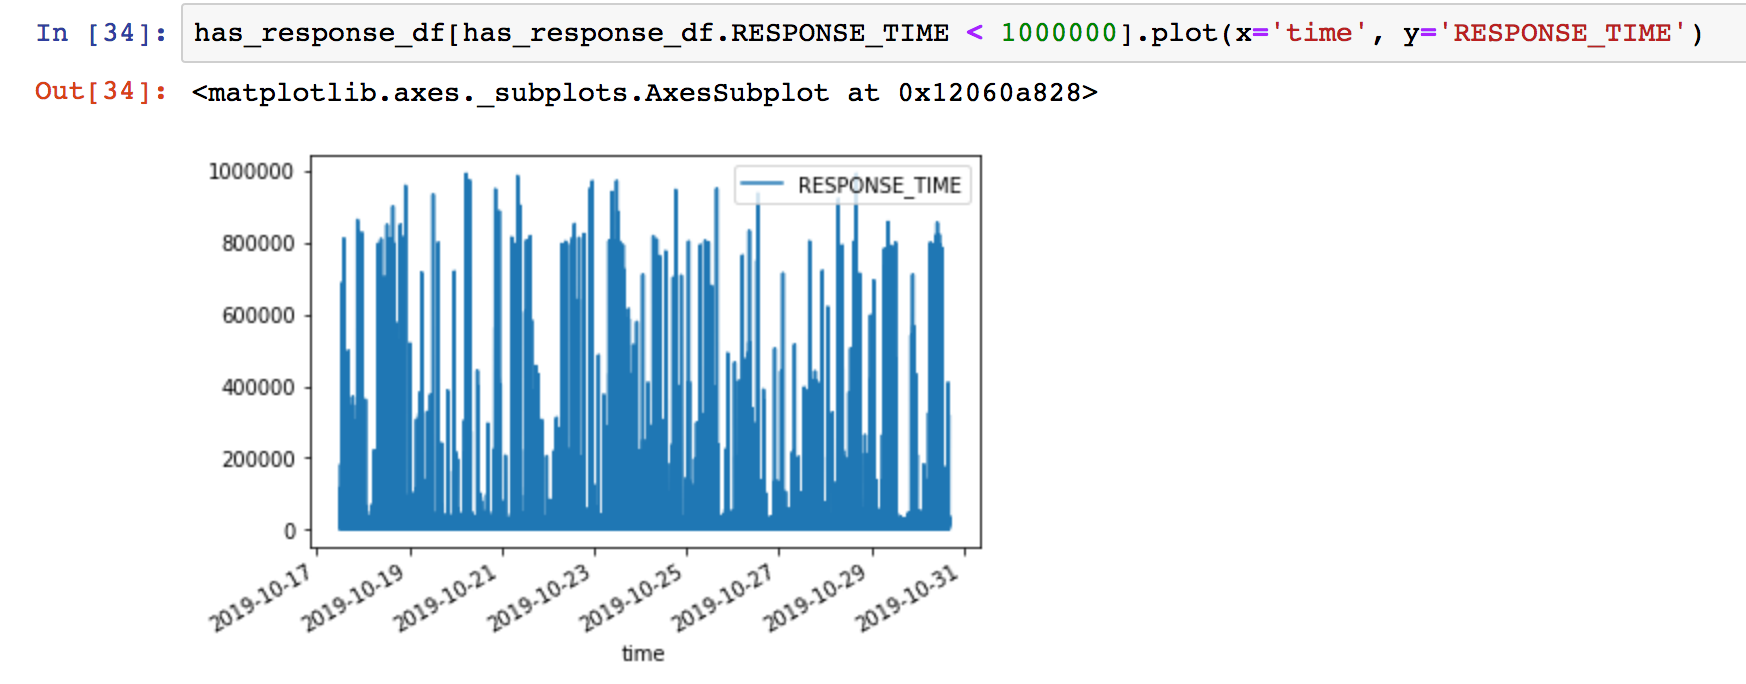
Average Response Time
I get the mean response time and the chart and it doesn’t really show a big drop after 17 October 2019

Apache gives the response time in microseconds, so 32606 microseconds is 32.61 milliseconds.
PHP5 vs PHP7 Benchmarked
Here is the data on the mean response times:
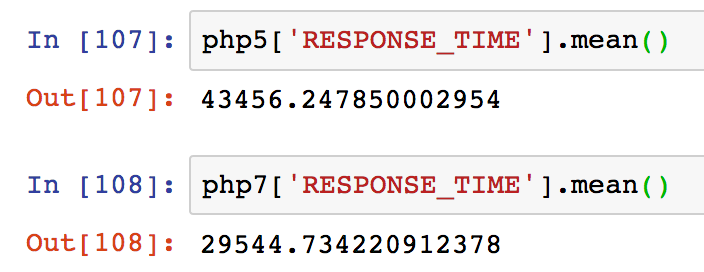
For PHP7.3 the mean response time was: 29.544 ms
For PHP5.6 the mean response time was: 43.456 ms
Error Rates
Looking at the error codes of the response codes and getting the percentage, nothing stands out particularly. An increase in 500 errors that might need to be checked out on PHP7.
 Finding Slow Pages
Now lets find what pages are really slow and look to remove or change them:

It is clear that the /share/performance page is a problem.
Things I found analysing the logs of Other Sites
Check the bots that are getting your stuff. I found there was a turnitin crawler, that is used to find plaguirism. The thing is – I don’t mind if people copy that word for word. I don’t want them to get in trouble for it.
Conclusion
So not the most scientifically correct study but there is enough evidence here to say that:
Response time on PHP7.3 is on average 13.912ms faster, which is a 32.01% increase in response time.
From our tests PHP7.3 is 32.01% faster in terms of page response time
Maximum and median response times also indicate the same trend.
If you have ideas on improving the data science and analytics of this post I would love that!
![]()