Is Digital Oceans 1-click-deploy ELK stack poorly configured on purpose?
Kibana is using too much memory
I wanted to see what juicy stats and info I could get out of the logs some of my servers were creating. Eventually I ran into the kibana using lots memory error. But I went through the Install ELK on ubuntu 14.04 tutorial and all was well but the certificate creation didn’t go too well so when filebeat and topbeat was installed on the client they would not restart and give an error:
ERR SSL client failed to connect with: dial tcp my.fqdn.co.za:5044: i/o timeout
So it turned out to be a mission so I resorted to using the One click install image tutorial and it worked like a charm.
I started with a 1Gb droplet and that gave issues like logstash just stopping, elasticsearch just stopping and kibana just stopping. So you had to restart and then after a while it still wouldn’t work.
Kibana node memory keeps increasing
So I moved to the 2Gb droplet and added it to newrelic so I could see what was ccasuing these problems. And I think I have found the culprit:
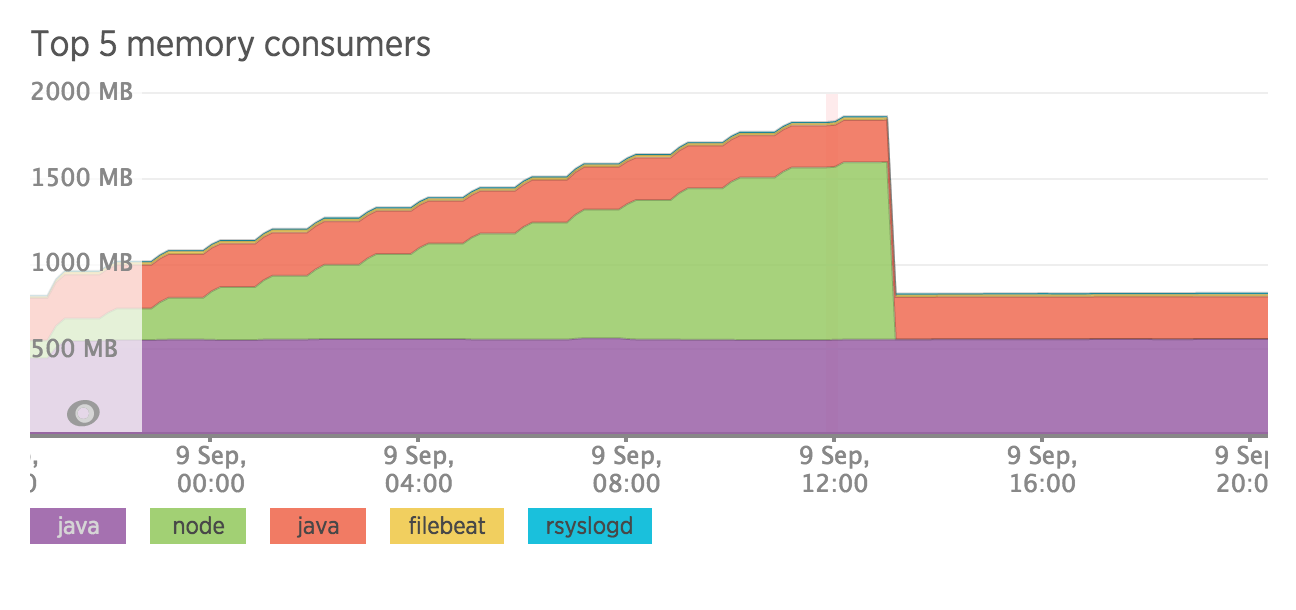
As you can see node just starts going out of hand from the start until it runs out of memory.
So is Digital ocean deliberately leaving this issue / not configuring this issue so that you go for a more powerful droplet. They are in the business of making you use more VPS’s.
But I digress…
Node is the kibana part of the ELK stack and this issue has been highlighted without a clear answer (like always) on Github and another one
But suggestions are saying add this to bin/kibana at the top:
NODE_OPTIONS="--max-old-space-size=250"
On the one click install that is located at:
/opt/kibana/bin/kibana
and it should look like:
NODE_OPTIONS="${NODE_OPTIONS:=--max-old-space-size=500}"
exec "${NODE}" $NODE_OPTIONS "${DIR}/src/cli" ${@}
I will implement this and let you know the results
Update (The following day)

So I set the limit to 500 and duely it restarted at 440 mb used, according to this graphic:
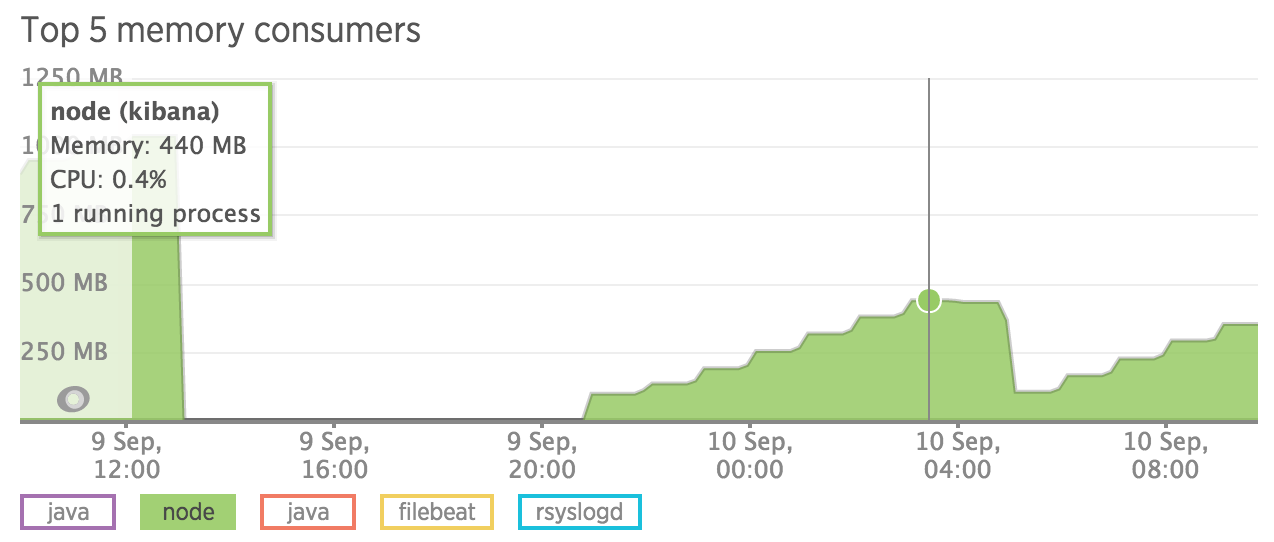
So summing up it may be possible to run this on a 1Gb RAM droplet.
The java instance for logstash runs at about 250mb max memory usage. Java for elasticsearch seems to max at 600 mb but maybe that is just because of the amount of data it has to search through / keep in memory. I’m also not sure if you can limit this amount. Filebeat uses about 15mb max. Rsyslog uses about 10mb.
So can you run the ELK stack on a 1Gb droplet?
Processes and Memory being used on the ELK stack
| User | Process | Count | CPU | Memory |
|---|---|---|---|---|
| elasticsearch | java | 1 | 8.5% | 564 MB |
| kibana | node | 1 | 0.4% | 325 MB |
| logstash | java | 1 | 3.8% | 239 MB |
| root | java | 1 | 81.1% | 154 MB |
| root | apt- |
1 | 7.5% | 42.6 MB |
| root | filebeat | 1 | 0.0% | 12.6 MB |
| root | fail |
1 | 0.0% | 9.37 MB |
| syslog | rsyslogd | 1 | 0.0% | 7.96 MB |
| www- |
nginx | 4 | 0.0% | 6.16 MB |
| newrelic | nrsysmond | 2 | 0.1% | 5.43 MB |
| root | vim | 1 | 0.0% | 5.21 MB |
| root | bash | 1 | 0.0% | 3.72 MB |
| root | sudo | 1 | 0.0% | 2.03 MB |
| root | init | 1 | 0.0% | 1.71 MB |
| root | sshd | 1 | 0.0% | 1.62 MB |
| sshd | sshd | 1 | 0.0% | 1.4 MB |
| root | nginx | 1 | 0.0% | 1.09 MB |
| root | getty | 6 | 0.0% | 944 KB |
| messagebus | dbus- |
1 | 0.0% | 820 KB |
| root | systemd- |
1 | 0.0% | 739 KB |
So the total excluding kibana is: 1059.75 mb
Well it looks like we are over budget as it stands. I will keep monitoring.
Making the ELK Stack run on a 1Gb Droplet (Update)
Well we can see that we can stop Kibana going out of control on the memory side. Now that try save some money by limiting it so it only needs a 2Gb droplet.
We are going to limit Kibana to 250Mb and Elasticsearch to 500Mb and hopefully everything goes smoothly. To change the limit on elasticsearch memory change: /etc/default/elasticsearch
Add the following:
ES_HEAP_SIZE=512m
That is what I had the best success with. Although there are additional steps outlined on stackoverflow.
So we will implement the above and wait until it safely runs under 1Gb memory, otherwise we are going to flip the switch and just downgrade to 1Gb and reboot.
Update
We are still seeing the jaggered edges created by the periodic increase and dropping of kibana memory usage.
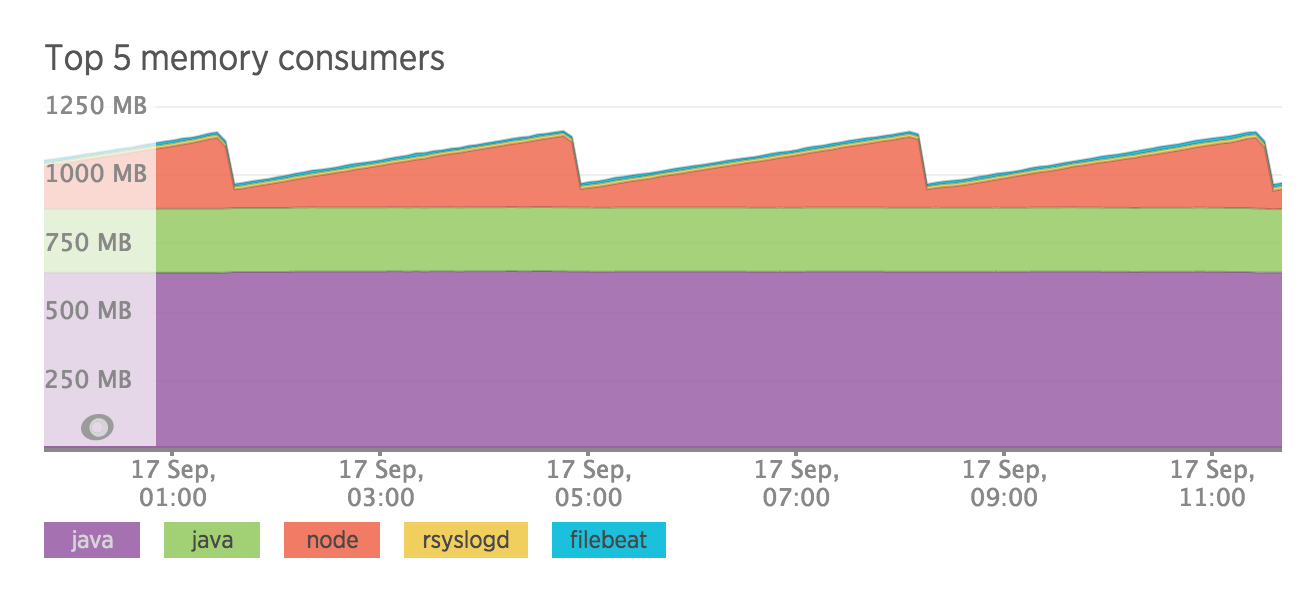
And this is pushing over out 1Gb max. Also elasticsearch is using 650 mb of memory or there abouts when we have told it to use 512 max. Maybe it realises there is spare memory so I will be downgrading it now to a 1Gb droplet.
So far so good…the retrieval or records and visualisation generation in kibana is less speedy but I can deal with it. Here is the current memory situation:
Well that didn’t work…
Elasticsearch is still using > 512mb memory and logstash stops as soon as it starts. So if I set the heap size in sudo vim /etc/init.d/elasticsearch:
ES_HEAP_SIZE=256mb“`
the elasticsearch service does not start…
Ah you need to also edit sudo vim /etc/elasticsearch/elasticsearch.yml
and add the following:
bootstrap.memory_lock: true
I will continue monitoring stability
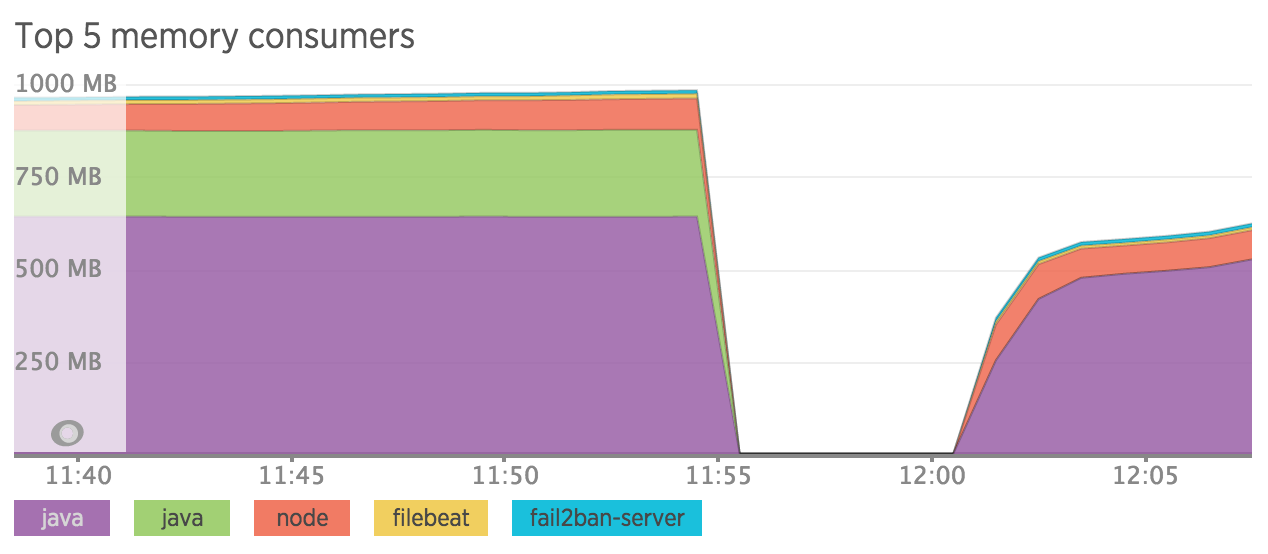
Update
Oh no looks like Kibana has died. The stability of the system is coming into question now.

Hmm it seems there is a one must die situation, as logstash also just dies after a while…
Somehow the server has dow, couldn’t ssh and newrelic not showing the server but on DO it still said it was up. After turning off and on from DO console I am now getting this error and it is the last straw.

Tis’ a shame but it is not in the price range at this stage. Will stop the server.