An interesting question has come up for a real world task.
What queue and python queue client should be used?
In this post, a few queue options will be tried in the attempt to answer which one should be used.
The Problem
The real world problem is currently a single api is used to serve client/customer requests that also services special business-to-business stock update requests.
The stock update requests take an average of 5 seconds but can go up to 14 seconds. This also puts some workers into a busy state for longer than usual affecting the scaling of the service. Furthermore clients have to wait up to 14 seconds for a results.
The Proposed Solution
To solve this problem. The function responsible for updating the stock will be done in a separate process from those serving customer requests.
When a stock update request comes in – it will be validated and put on a queue. Then a response of 200 OK (or 202 Acccepted) will be returned to the http client.
In the background a consumer process will be looking at the queue and running the stock update queries that used to be run by the api.
The Queue and Library Options
Message queue brokers distribute messages from producers to consumers
Available queue brokers infrastructure wise at the moment is:
- apache kafka – Apache Kafka is an open-source distributed event streaming platform
- amazon sqs – secure, durable and available hosted queue
- redis – an open source (BSD licensed), in-memory data structure store used as a database, cache, message broker, and streaming engine
- postgresql – an object-relational database management system
For a complete list of available task queues check taskqueues.com
Python Libraries and frameworks:
- celery – Celery is a simple, flexible, and reliable distributed system to process vast amounts of messages, while providing operations with the tools required to maintain such a system. Supports redis and sqs among others.
- rq – RQ (Redis Queue) is a simple Python library for queueing jobs and processing them in the background with workers
- dramatiq – A background task processing library for Python with a focus on simplicity, reliability and performance. Used with rabbitmq and redis as brokers.
- huey – a task queue. Brokers: redis, sqlite, file-system, or in-memory storage.
- faust – A library for building streaming applications in Python. Uses apache kafka exclusively.
- kafka-python – Python client for the Apache Kafka distributed stream processing system
Measuring
To measure and make the choice there are 3 categories of importance:
- resilience (not losing messages)
- speed and performance
- simplicity (joy of developing)
The combinations of brokers and libraries:
- apache kafka (broker) + kafka-python (library)
- apache kafka (broker) + faust (library)
- redis (broker) + rq (library)
- redis (broker) + huey (library)
- amazon sqs (broker) + celery (library)
To compare across limitations the tests have been altered. All tests are done with a single process and thread on same hardware – for both the producer and consumer. The producer is making db queries to formulate the payload and is the most taxing part of the process.
Realiability: The test is 100 messages containing 100 stock records each are sent to the queue with the consumer off. Then 5 minutes are waited. Then the consumer is started. It is stopped halfway. Then restarted. All messages should be seen. TIme to send messages to the queue is kept.
For performance: 10_000 messages containing 100 stock records each are sent to the queue. The conumer consumes them as they come in with default settings.
The total time to complete is kept.
Amazon SQS + Celery
No Go. It was seen after testing that there is a maximum limit on the size of the message 256 KB using the python boto client on AWS SQS.
botocore.exceptions.ClientError: An error occurred (InvalidParameterValue) when calling the SendMessage operation: One or more parameters are invalid. Reason: Message must be shorter than 262144 bytes (256 KB)If you are thinking of serialising a protocol buffer message, put it on the queue and deserialise the other side. It won’t work as celery functions. You can’t pass a byte type variable to a Celery function. This is a limitation of celery and not of the sqs queue broker as far as understood.
One way to get around the issue is to split the payload into several smaller chunks and then add it to the queue. The problem is we want to respond to the client and handle it in one go.
Where typically 10_000 stock updates were made per request. The size limits means that the max number sqs can handle is 800 per request.
The approximate size of the payload is: 43795 (via pickle) or 172437 (via json.dumps)
1724183 bytes about 1.724183 MB
Reliability
100 messages
Time to produce messages: 4.69 s
Time to consume messages including consumer startup: 10.18s
Performance
10_000 messages
Time to produce messages: 485.48 s
Time to consume messages: 520.18 s
Monitoring
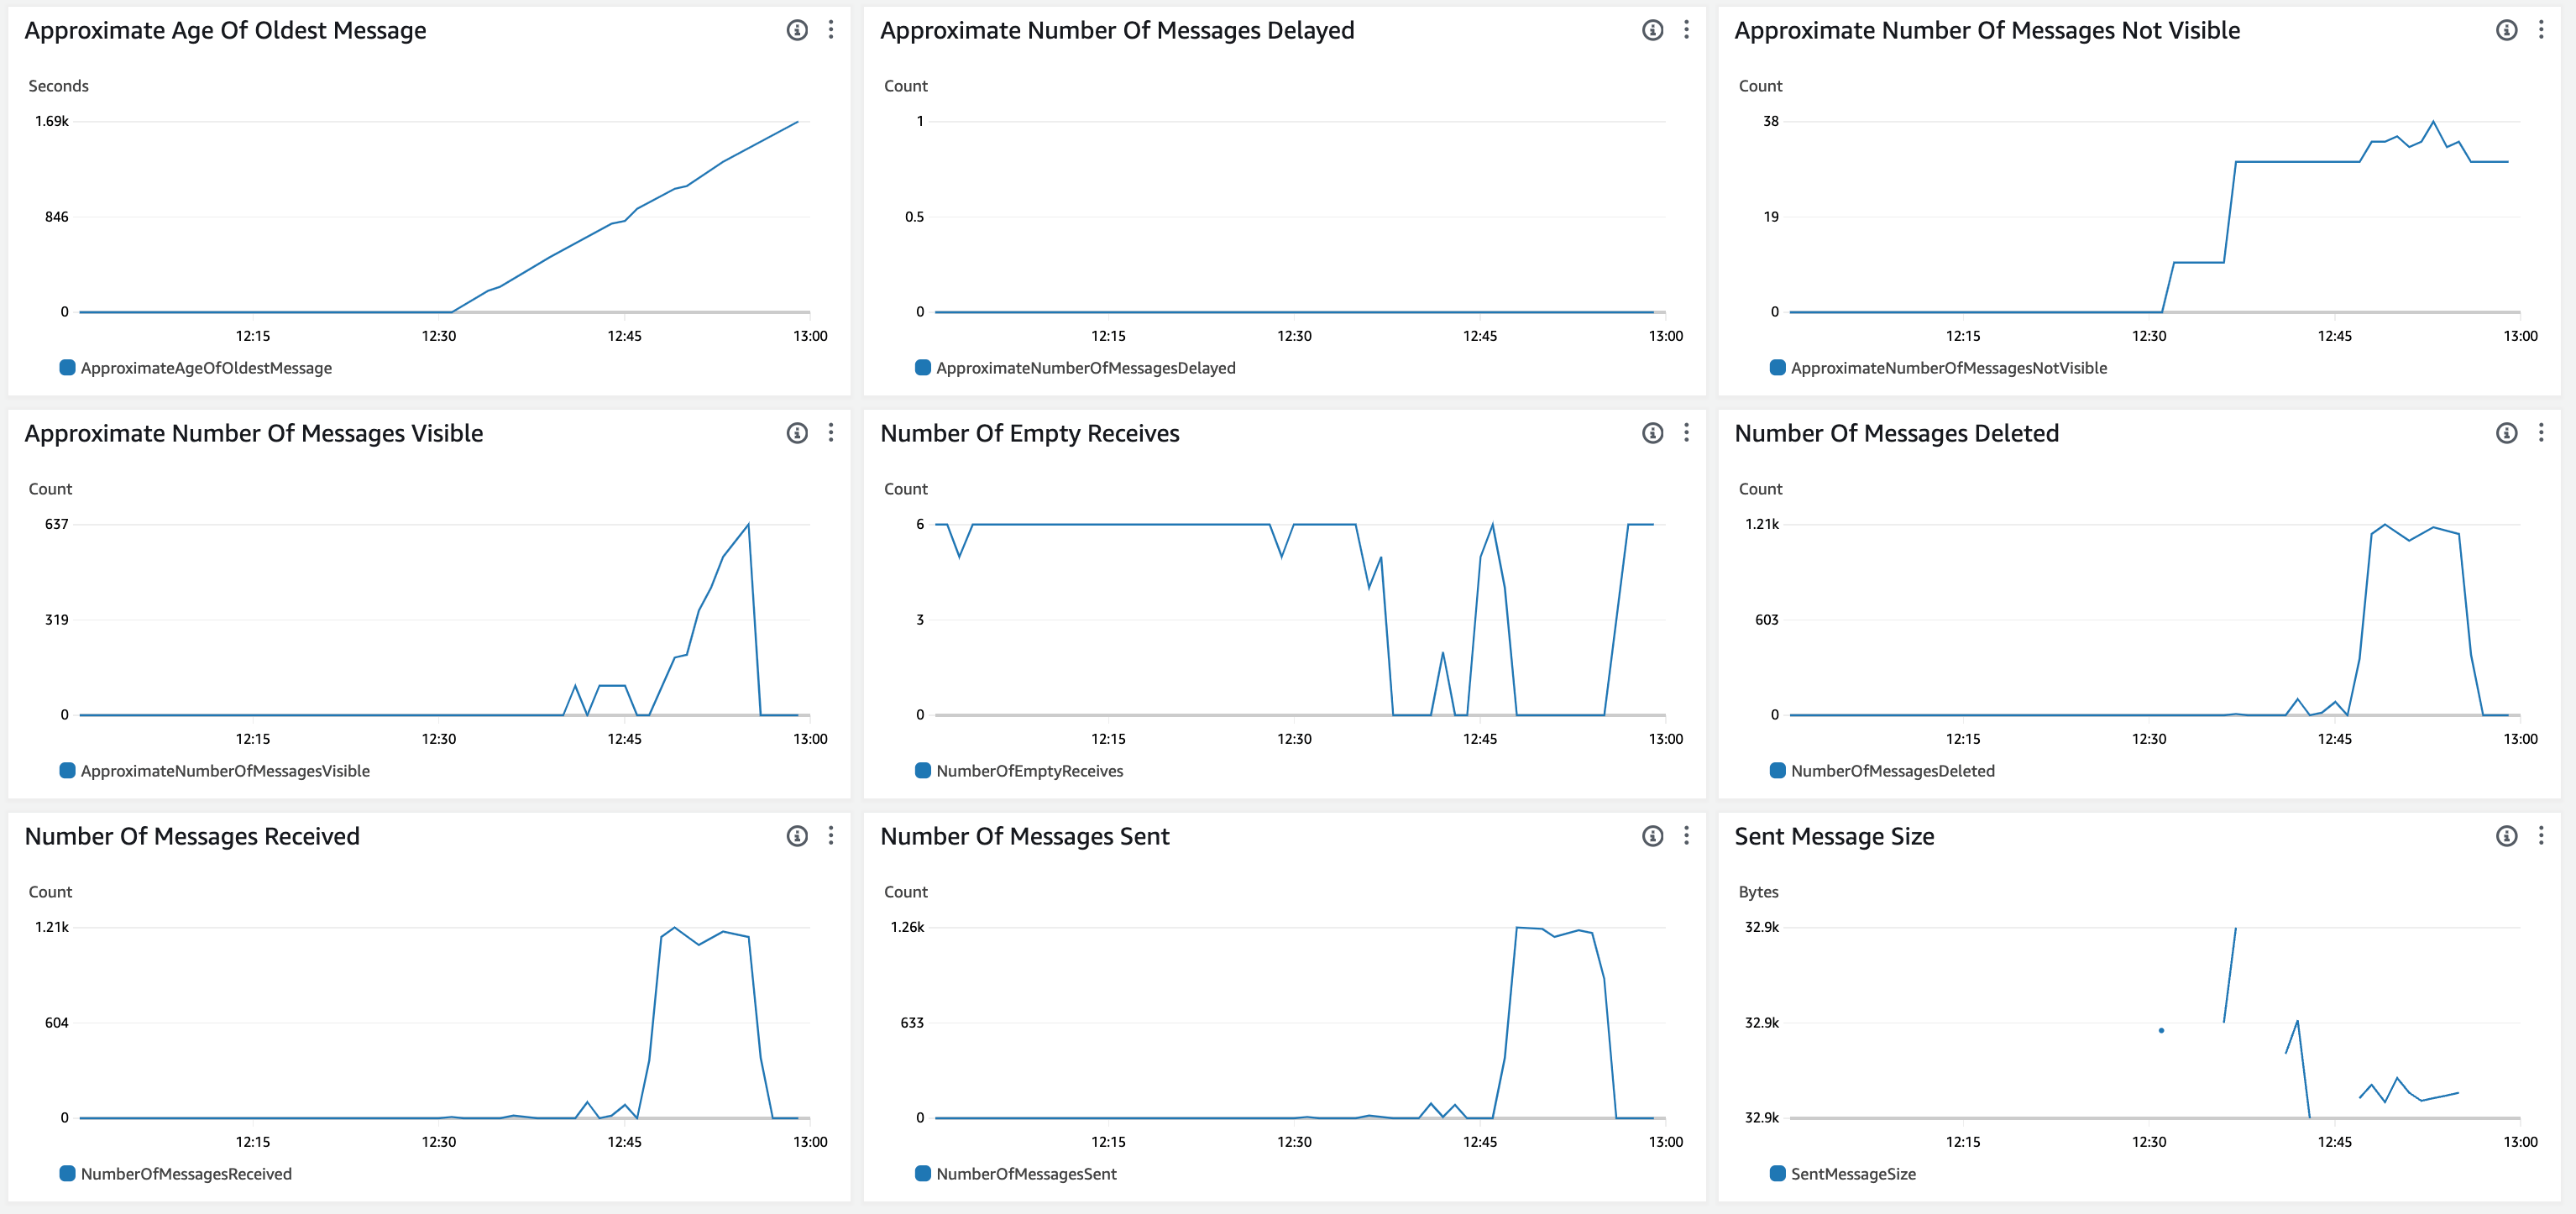
The Number of Messages not Visible and Approximate Age of Oldest Message are due to creating messages that have not been consumed. The same queue is used for multiple tasks with celery and sqs.
Apache Kafka + Kafka-Python
The max size limit on a kafka message is by default 1MB
Kafka supports messages as json or binary – so sending bytes from a protocol buffer message works
The size of messages is also limited on kafka. This is a good thing as it is best to have events small.
The error message:
kafka.errors.MessageSizeTooLargeError: [Error 10] MessageSizeTooLargeError: The message is 1724201 bytes when serialized which is larger than the maximum request size you have configured with the max_request_size configurationThat is 1.72 MB and larger than kafka can handle.
Think it would be safe to split the updates into batches of 5000 maybe, as 10_000 gave this error.
The size of 5000 records is around: 850 KB
Reliability
100 messages
Time to produce messages: 3.52 s
Time to consume messages including consumer startup: 9.23s
Performance
10_000 messages
Time to produce messages: 303.30 s
Time to consume messages: 400.54 s
Monitoring
Kafka is called MSK on aws. There is no topic based monitoring and metrics that can be seen. Just cluster metrics.
The kafka producer can give metrics with producer.metrics():
{
    "kafka-metrics-count": {
        "count": 72.0
    },
    "producer-metrics": {
        "batch-size-avg": 17341.931544865864,
        "batch-size-max": 17364.0,
        "bufferpool-wait-ratio": 0.0,
        "byte-rate": 317140.1781220179,
        "compression-rate-avg": 1.0,
        "connection-close-rate": 0.0,
        "connection-count": 3.0,
        "connection-creation-rate": 0.0,
        "incoming-byte-rate": 1183.465976873086,
        "io-ratio": 0.011693451385089256,
        "io-time-ns-avg": 196607.5675620611,
        "io-wait-ratio": 0.8312934164701411,
        "io-wait-time-ns-avg": 13976968.088039227,
        "metadata-age": 29.271181396484376,
        "network-io-rate": 36.82275634388318,
        "outgoing-byte-rate": 320075.00303723844,
        "produce-throttle-time-avg": 0.0,
        "produce-throttle-time-max": 0.0,
        "record-error-rate": 0.0,
        "record-queue-time-avg": 0.0003741005854293442,
        "record-queue-time-max": 0.005525112152099609,
        "record-retry-rate": 0.0,
        "record-send-rate": 18.287478506582502,
        "record-size-avg": 17280.931544865864,
        "record-size-max": 17303.0,
        "records-per-request-avg": 1.0,
        "request-latency-avg": 1.8668617552175286,
        "request-latency-max": 226.85742378234863,
        "request-rate": 18.39612333495251,
        "request-size-avg": 17399.04208600183,
        "request-size-max": 17437.0,
        "requests-in-flight": 0.0,
        "response-rate": 18.396712135383538,
        "select-rate": 59.47599152670679
    },
    "producer-node-metrics.node-1": {
        "incoming-byte-rate": 412.64360306725,
        "outgoing-byte-rate": 110305.3115090831,
        "request-latency-avg": 2.120215295138706,
        "request-latency-max": 226.85742378234863,
        "request-rate": 6.350910702062047,
        "request-size-avg": 17368.420485175204,
        "request-size-max": 17437.0,
        "response-rate": 6.3509953199642135
    },
    "producer-node-metrics.node-2": {
        "incoming-byte-rate": 327.12969864636364,
        "outgoing-byte-rate": 89012.24652921017,
        "request-latency-avg": 1.8859922287854862,
        "request-latency-max": 49.58176612854004,
        "request-rate": 5.1113282427307976,
        "request-size-avg": 17414.695652173912,
        "request-size-max": 17429.0,
        "response-rate": 5.111400368042997
    },
    "producer-node-metrics.node-3": {
        "incoming-byte-rate": 429.29476794851394,
        "outgoing-byte-rate": 116813.54765573732,
        "request-latency-avg": 1.6409465071505869,
        "request-latency-max": 14.189720153808594,
        "request-rate": 6.707635381433216,
        "request-size-avg": 17415.007633587786,
        "request-size-max": 17433.0,
        "response-rate": 6.707729239837023
    },
    "producer-node-metrics.node-bootstrap-0": {
        "incoming-byte-rate": 0.0,
        "outgoing-byte-rate": 0.0,
        "request-latency-avg": 0.0,
        "request-rate": 0.0,
        "request-size-avg": 0.0,
        "response-rate": 0.0
    },
    "producer-topic-metrics.test-stephen": {
        "byte-rate": 317135.8268814837,
        "compression-rate": 1.0,
        "record-error-rate": 0.0,
        "record-retry-rate": 0.0,
        "record-send-rate": 18.287220800352376
    }
}
Performance as bytes
When using a protocol buffer message that serialises the message to bytes (instead of sending json) the performance is measured.
The size of 10_000 records is 490,012 bytes (approximately 490 KB).
For 5000 records, the size is 245,006 bytes (approximately 245 KB).
So the binary representation is about 3 times smaller and hence 3 times less movement of data over the network.
Reliability
100 messages
Time to produce messages: 2.91 s (with a size of 4900 - much less than json)
Time to consume messages including consumer startup: 10.66s
Performance
10_000 messages
Time to produce messages: 262.09 s
Time to consume messages: 530.83 s
Slightly faster to product than the json version. Consumption took longer.
Redis + RQ
Redis appears to not have a max size for values.
Redis has been known to become unavailable on the environment at times.
Was able to connect to local redis but not the redis cluster running in aws.
Well could connect but weird errors being raised.
This test is with a locally running redis instance. Unlike kafka and sqs tests.
Similar to celery in that you deal with python functions – abstracting away serialisation and deserialisation.
It could not produce messages on the external redis (aws elasticache) instance:
redis.exceptions.ResponseError: Command # 1 (SADD rq:queues rq:queue:test) of pipeline caused error: MOVED 8713 xxx.euw1.cache.amazonaws.com:6379Reliability
Remember 1 worker
100 messages
Time to produce messages: 2.54 s (as json) # lightning
Time to consume messages including consumer startup: 240s # super slow
The reason it was super slow is that the rq worker shell script does importing of libraries it needs after forking in a fetch-fork-execute loop. More in the rq performance notes.
So important to ensure the consumer is architected in a way that lots of work is not done at startup or create your own worker process / consumer.
After the fix
Time to produce messages: 2.40 s
Time to consume messages including consumer startup: 9.13s
The fastest but remember these tests were run lcoally
Performance
…
Monitoring
rq infoMonitoring looks decent on rq and is a first class citizen.
to view stats over time:
rq info --interval 1Redis + Huey
Not workable.
Appears the redis problems are due to the conenction with a redis cluster – not a single node redis instance which is expected.
![]()