Bollinger Oscillator Overview
The bollinger oscillator is an economic indicator which measures the standard deviation of the price from a simple moving average. It can be calculated using a 20-day simple moving average but is usually calculated using a 9-day moving average.
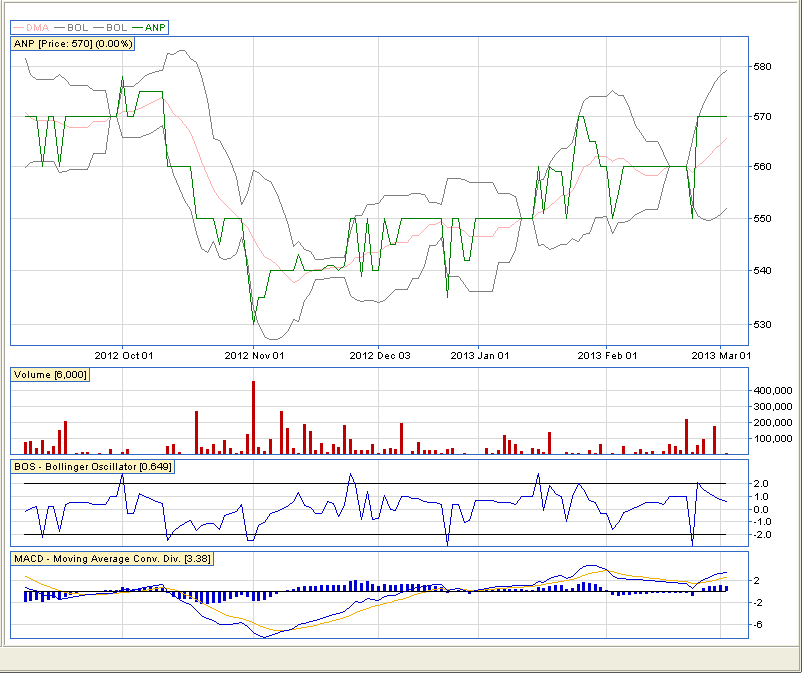
The bollinger oscillator is pictured below:
Just below the volume and above the MACD is the Bollinger Oscillator (BOS) indicator.
A signal to buy a share would be when the Bollinger Oscillator (BOS) is below -2. A signal to sell a share would be when the Bollinger Oscillator (BOS) is above 2. Meaning that the ruling share price is 2 standard deviations below and above the moving average respectively. You can use the bands in the same way buying when the price moves below the lower band and selling when the share moves above the upper band.
BOS Calculation
To Calculate the Bollinger Oscillator (BOS):
- Find the “9-day moving average” mean (n1 + n2 … + n9)/9
- Find the standard deviation of the 9-days
- Subtract 9-day Moving average from the current ruling price
- Take the answer of the above divide by the standard deviation (of the 9 days)
- Answer is the BOS (Bollinger Oscillator)
Bands Calculation
To Calculate the Bollinger Bands:
- Find the 20-day moving average average (n1 + n2 … + n20)/20
- Find the standard deviation of the 20-days
- Upper Band = 20-day Moving Average + (2 x standard deviation of the 20-days)
- Lower Band = 20-day Moving Average – (2 x standard deviation of the 20-days)
Hope this helps you in your adventures on the markets!
NB: Remember the BOS uses a 9-day moving average but Bollinger specifies a 20-day moving average as recommened. You can chop and change for an indicator to fit your requirement. If you want to learn more about the man, John Bollinger, or Bollinger Bands as indicators, click the respective links.
Good Trading
