Was able to try out Rackzar’s AMD Ryzen VPS recently. This post is about the experience and performance.
The UI to Create
The user interface is easy to navigate and there is lots one can do. It looks very similar to hostking’s. Wondering if this is a standard frontend that can be deployed by infrastructure service providers.
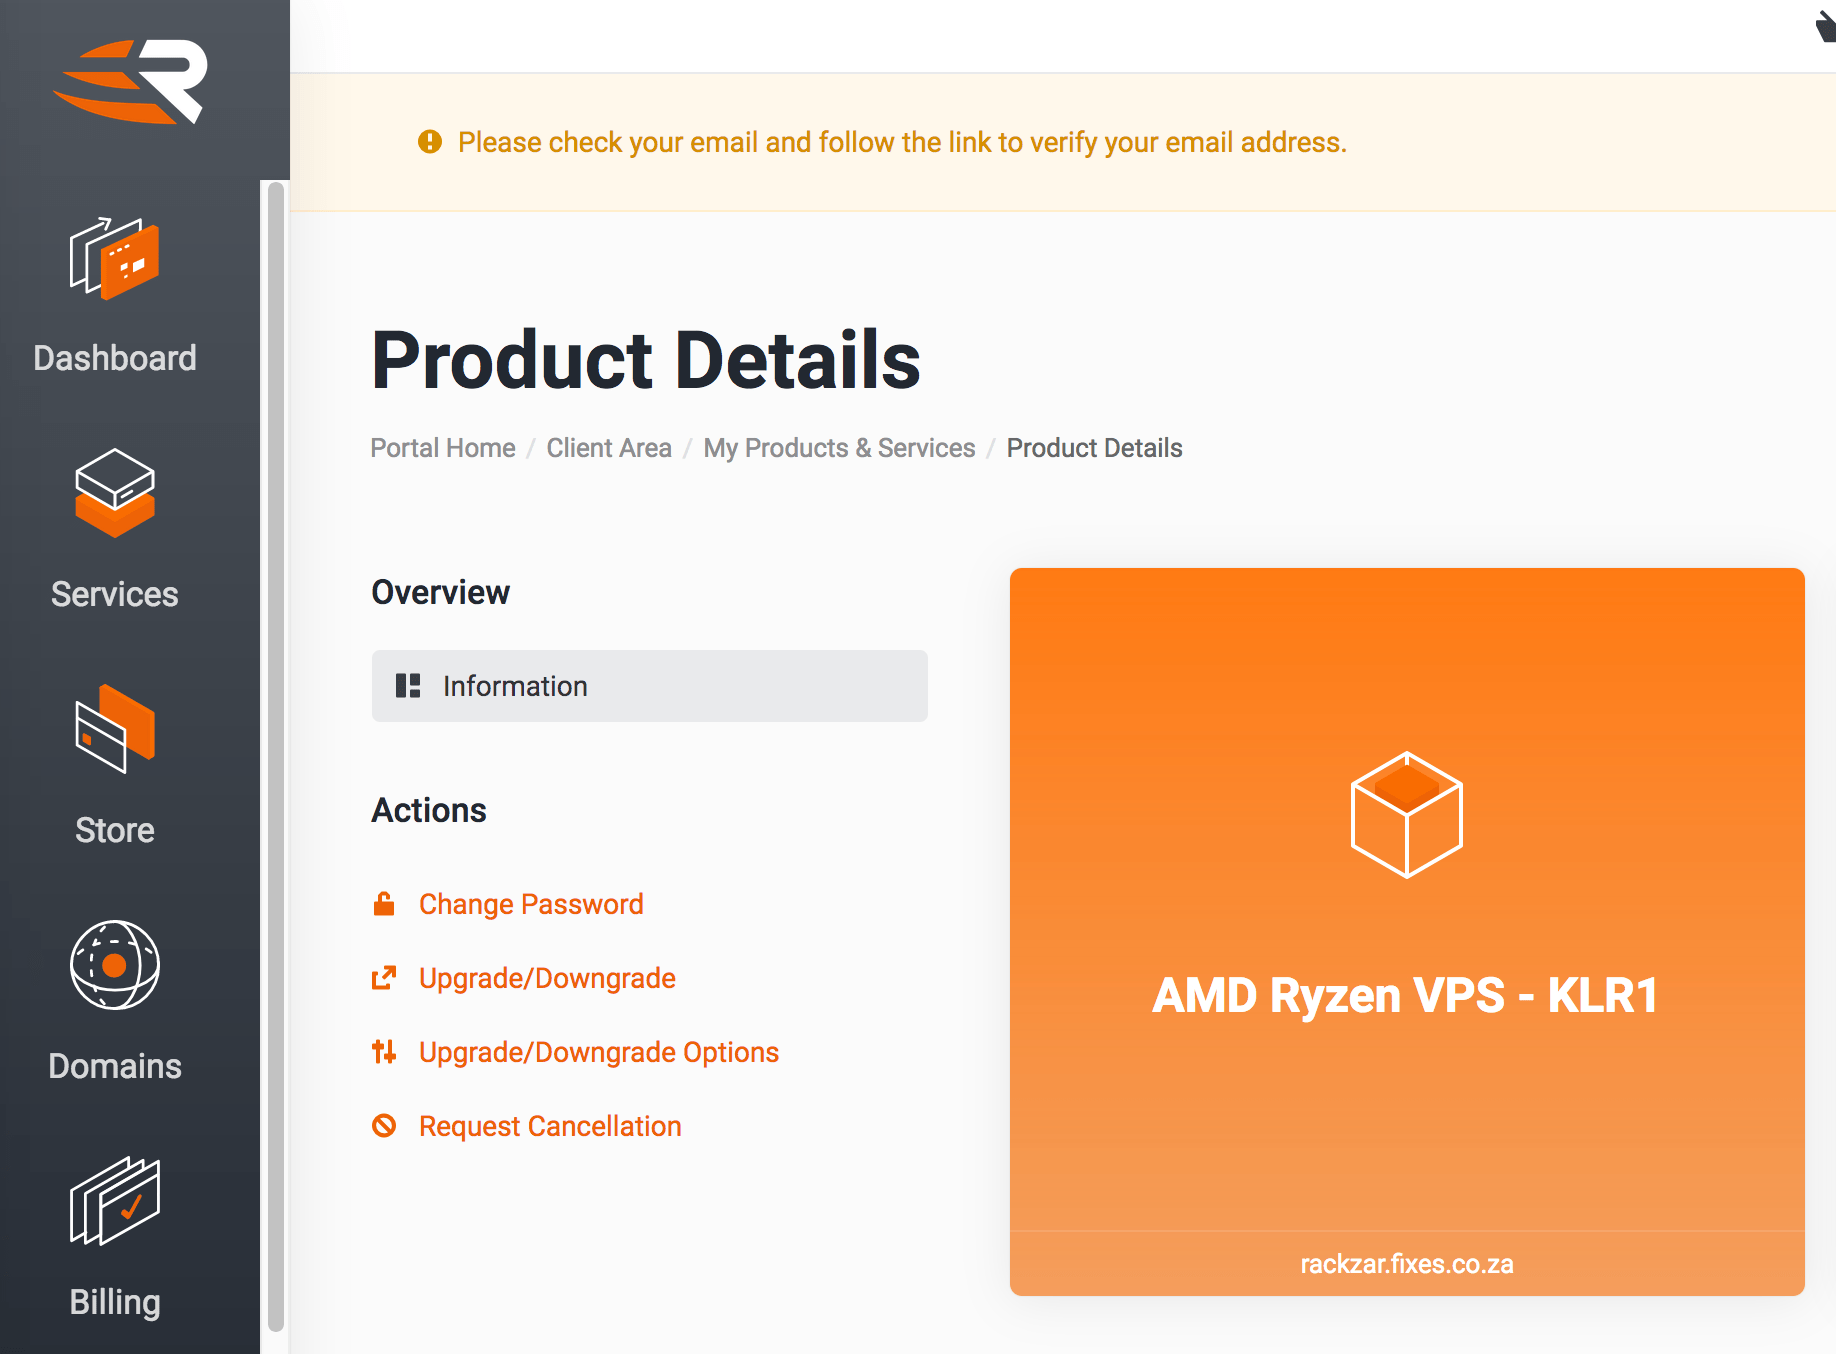
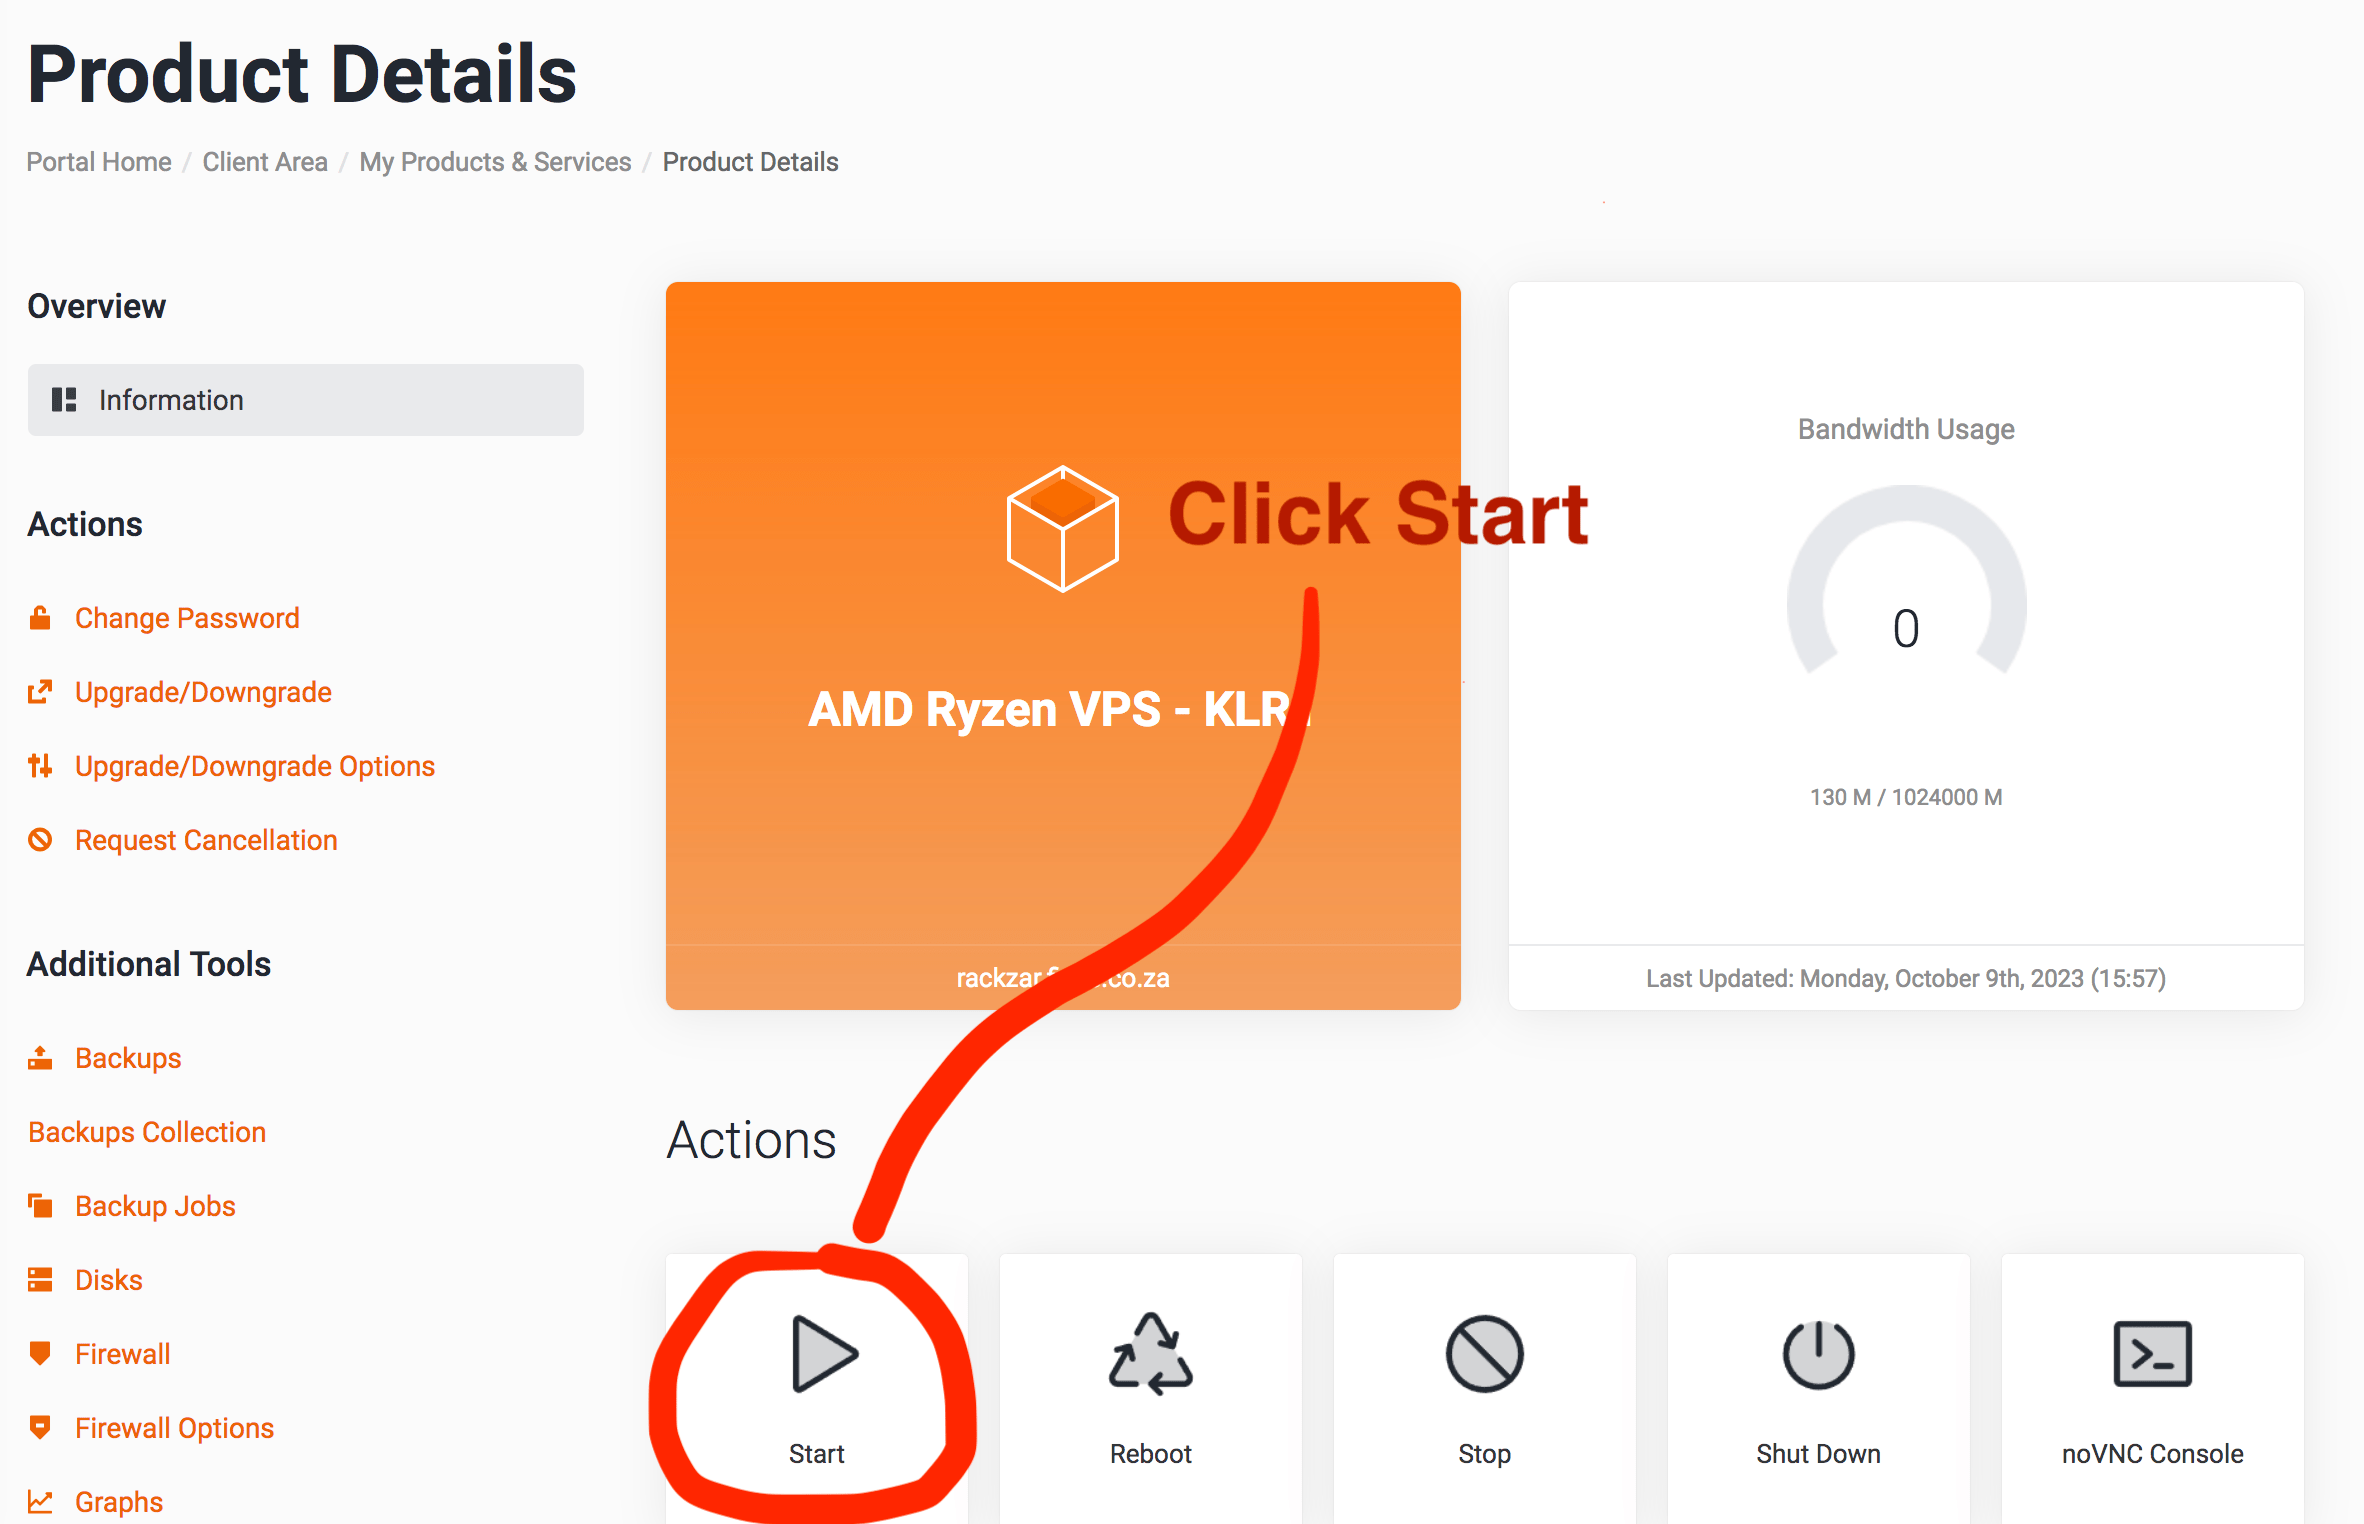
It took about a minute to provision a AMD Ryzen VPS. Note that you have to manually start it – it is provisioned in an off state. This seems different from some other providers who usually boot up the machine after provisioning automatically – however there may be a specific reason for this. Maybe to configure an external firewall before initial boot.
The VPS was created with the following specs
AMD Ryzen VPS - KLR1 R299.00 /mo
(Pro Rata 01/11/2023)
Linux Distro: Ubuntu.Server.20.LTS
Deployment Action: Fast Deploy
VPS Backups: 1 Backup Slot
Datacentre: Cape Town
Initial SSH and Tests
Host was up – pinging from JHB to the VPS in CPT.
PING 102.213.6.51 (102.213.6.51): 56 data bytes
64 bytes from 102.213.6.51: icmp_seq=0 ttl=53 time=34.520 ms
64 bytes from 102.213.6.51: icmp_seq=1 ttl=53 time=26.439 ms
64 bytes from 102.213.6.51: icmp_seq=2 ttl=53 time=25.763 ms
Trying to ssh in:
$ ssh root@102.213.6.51
Please login as the user "root" rather than the user "root".

Connection to 102.213.6.51 closed.
During setup – the password and ssh public key was entered. To successfully login I had to force password auth:
ssh -o PreferredAuthentications=password -o PubkeyAuthentication=no root@102.213.6.51Then remove some lines from the top of the ~/.ssh/authorized_keys file that printed the "Please login as the user…" message and exited.
Specs
Memory (4 GB):
root@rackzar:~# free -m
              total        used        free      shared  buff/cache   available
Mem:           3919         237        2357           1        1324        3416
Swap:             0           0           0
Info on what free, available and used RAM means…
Storage (50GB):
The storage is NVMe an improved protocol for SSDs.
root@rackzar:~# lsblk -o NAME,FSTYPE,LABEL,MOUNTPOINT,SIZE,MODEL
NAME    FSTYPE   LABEL           MOUNTPOINT         SIZE MODEL
loop0   squashfs                 /snap/core20/1891 63.5M
loop1   squashfs                 /snap/lxd/24061   91.9M
loop2   squashfs                 /snap/snapd/19361 53.3M
loop3   squashfs                 /snap/core20/2015 63.5M
sr0     iso9660  cidata                               4M QEMU_DVD-ROM
vda                                                  50G
├─vda1  ext4     cloudimg-rootfs /                 49.9G
├─vda14                                               4M
└─vda15 vfat     UEFI            /boot/efi          106M

root@rackzar:~# df -h
Filesystem      Size  Used Avail Use% Mounted on
udev            1.9G     0  1.9G   0% /dev
tmpfs           392M  1.1M  391M   1% /run
/dev/vda1        49G  2.2G   47G   5% /
tmpfs           2.0G     0  2.0G   0% /dev/shm
tmpfs           5.0M     0  5.0M   0% /run/lock
tmpfs           2.0G     0  2.0G   0% /sys/fs/cgroup
/dev/vda15      105M  6.1M   99M   6% /boot/efi
/dev/loop1       92M   92M     0 100% /snap/lxd/24061
/dev/loop0       64M   64M     0 100% /snap/core20/1891
/dev/loop2       54M   54M     0 100% /snap/snapd/19361
/dev/loop3       64M   64M     0 100% /snap/core20/2015
tmpfs           392M     0  392M   0% /run/user/0
CPU (2 CPUs):
root@rackzar:~# lscpu
Architecture:                    x86_64
CPU op-mode(s):                  32-bit, 64-bit
Byte Order:                      Little Endian
Address sizes:                   48 bits physical, 48 bits virtual
CPU(s):                          2
On-line CPU(s) list:             0,1
Thread(s) per core:              1
Core(s) per socket:              2
Socket(s):                       1
NUMA node(s):                    1
Vendor ID:                       AuthenticAMD
CPU family:                      25
Model:                           97
Model name:                      AMD Ryzen 9 7900X 12-Core Processor
Stepping:                        2
CPU MHz:                         4699.988
BogoMIPS:                        9399.97
Virtualization:                  AMD-V
Hypervisor vendor:               KVM
Virtualization type:             full
L1d cache:                       128 KiB
L1i cache:                       128 KiB
L2 cache:                        1 MiB
L3 cache:                        16 MiB
Performance Tests
It must be noted that these tests are adhoc and are not meant to be a thorough benchmark with all things being equal.
Always ensure to test a real world scenario on the available options to decide for yourself.
dd is not seen as a good test for ssd’s and fio – flexible I/O tester – is preferred by the cloudzy site. Some tests that can be used are on google cloud fio.
Write speed:
root@rackzar:~# dd if=/dev/zero of=tmpfile bs=1M count=256 conv=fdatasync
256+0 records in
256+0 records out
268435456 bytes (268 MB, 256 MiB) copied, 0.0856483 s, 3.1 GB/s
Compared to other providers:
Both were run the second time – so disk cache was used and is probably not a true reflection
hostking (SSD): 242 MB/s
rackzar (SSD with NVMe): 3.1 GB/s
Nonetheless at this task the rackzar setup is 13 times faster than the standard hostking VPS.
Read speed:
root@rackzar:~# dd if=tmpfile of=/dev/null bs=1M count=256
256+0 records in
256+0 records out
268435456 bytes (268 MB, 256 MiB) copied, 0.0166541 s, 16.1 GB/s
Compared to other providers:
cloudafrica (SSD): 6.2 GB/s
hostking (SSD): 2.5 GB/s
rackzar (SSD with NVMe): 16.1 GB/s
Disk caching involved again
Nonetheless – on this instance of the test the rackzar setup is 3 times faster than cloudafrica with a standard cpu and SSD storage.
CPU Test
root@rackzar:~# dd if=/dev/zero bs=1M count=1024 | md5sum
1024+0 records in
1024+0 records out
1073741824 bytes (1.1 GB, 1.0 GiB) copied, 1.20858 s, 888 MB/scd573cfaace07e7949bc0c46028904ff  -
Compared to other providers:
cloudafrica (4096): 524 MB/s
hostking (4096): 403 MB/s
rackzar (4096): 888 MB/s
Sysbench
root@rackzar:~# sysbench --cpu-max-prime=20000 cpu run
sysbench 1.0.18 (using system LuaJIT 2.1.0-beta3)

Running the test with following options:
Number of threads: 1
CPU speed:
    events per second:  2501.83
    total number of events:              25020

Latency (ms):
avg: 0.40- hostking:
- events per second: 329.97
- avg latency: 3.03 ms
- cloudafrica:
- events per second: 1069.15
- avg latency: 0.93 ms
2 threads:
root@rackzar:~# sysbench --threads=2 --cpu-max-prime=20000 cpu run
sysbench 1.0.18 (using system LuaJIT 2.1.0-beta3)

Running the test with following options:
Number of threads: 2
CPU speed:
    events per second:  4944.82
    total number of events:              49451

Latency (ms):
avg: 0.40- hostking:
- events per second: 629.06
- avg latency: 3.17 ms
- cloudafrica:
- events per second: 2130.06
- avg latency: 0.94 ms
Socketify Test
- hostking: Requests/sec: 12373.29
- cloudafrica: Requests/sec: 53589.60
- rackzar: Requests/sec: 120495.67
Comfortably double than the nearest at this task. Responding to HTTP requests.
Fast API Test
A fast api project was created that creates a uuid and returns it as json.
Wrk:
wrk -c 4 -d 30s -t 4 http://127.0.0.1:4000/

Running 30s test @ http://127.0.0.1:4000/
  4 threads and 4 connections
  Thread Stats   Avg      Stdev     Max   +/- Stdev
    Latency   375.81us  115.71us  10.10ms   80.21%
    Req/Sec     2.68k   344.48     3.71k    75.42%
  320790 requests in 30.10s, 52.62MB read
Requests/sec:  10657.65
Transfer/sec:      1.75MB
Compared to peers:
RPS
hostking: 547.98 RPS
cloudafrica: 1750 RPS
digitalocean: 1010 RPS
Rackzar: 10657 RPS
Response time (avg):
hostking: 1.86ms
cloudafrica: 586.32 us
digitalocean: 1.02 ms
Rackzar: 375.81 us (micro seconds)
Apache bench:
ab -n 10000 -c 100 http://127.0.0.1:4000/

Concurrency Level:      100
Time taken for tests:   0.992 seconds
Complete requests:      10000
Failed requests:        0
Total transferred:      1720000 bytes
HTML transferred:       470000 bytes
Requests per second:    10079.12 [#/sec] (mean)
Time per request:       9.921 [ms] (mean)
Time per request:       0.099 [ms] (mean, across all concurrent requests)
Transfer rate:          1692.98 [Kbytes/sec] received
Against competitors:
hostking: 1709.38 RPS (0.585 ms)
cloudafrica: 5334.08 RPS (0.187 ms)
digitalocean: 3418.71 RPS (0.293 ms)
rackzar: 10079 RPS (0.099 ms)
Double as many requests per second could be handled compared to the closest competitor in this test
New Compression Test
Tests performed using lzbench:
Using the tmpfile created earlier with dd:
root@rackzar:~# lzbench tmpfile
lzbench 1.8 (64-bit Linux)   Assembled by P.Skibinski
    Compressor name         Compress. Decompress. Compr. size  Ratio Filename
    memcpy                  21057 MB/s 20999 MB/s   268435456 100.00 tmpfile
    lizard 1.0 -10          17449 MB/s 24589 MB/s       79881   0.03 tmpfile
    lz4 1.9.2               33136 MB/s 23319 MB/s     1052698   0.39 tmpfile
    pithy 2011-12-24 -0     20869 MB/s 23625 MB/s       20496   0.01 tmpfile
    snappy 2019-09-30       27323 MB/s  4203 MB/s    12591109   4.69 tmpfile
    zstd 1.4.5 -1            4286 MB/s 25562 MB/s        8211   0.00 tmpfile
To compare – the hostking results are:
    lzbench 1.8 (64-bit Linux)   Assembled by P.Skibinski
    Compressor name         Compress. Decompress. Compr. size  Ratio Filename
    memcpy                   2087 MB/s  2049 MB/s   268435456 100.00 tmpfile
    lizard 1.0 -10           1340 MB/s  1441 MB/s       79881   0.03 tmpfile
    lz4 1.9.2                1706 MB/s  1554 MB/s     1052698   0.39 tmpfile
    pithy 2011-12-24 -0      1634 MB/s  1992 MB/s       20496   0.01 tmpfile
    snappy 2019-09-30        1852 MB/s  1032 MB/s    12591109   4.69 tmpfile
    zstd 1.4.5 -1             809 MB/s  4181 MB/s        8211   0.00 tmpfile
More than 10 times faster than hostking – with compression and decompression. Not sure if the good results by rackzar can be attributed to the improved CPU, SSD with NVMe or both.
Real World Website
A web app with fastapi and postgres is tested:
Cloudafrica:
$ wrk -c 5 -t 1 -d 30s http://127.0.0.1:8000/
    Running 30s test @ http://127.0.0.1:8000/
    1 threads and 5 connections
    Thread Stats   Avg      Stdev     Max   +/- Stdev
        Latency    39.52ms   16.11ms 229.73ms   94.31%
        Req/Sec   130.85     26.14   161.00     85.95%
    3918 requests in 30.05s, 17.84MB read
    Requests/sec:    130.39
    Transfer/sec:    608.10KB
Rackzar:
root@rackzar:~# wrk -c 5 -t 1 -d 30s http://127.0.0.1:8000/
Running 30s test @ http://127.0.0.1:8000/
  1 threads and 5 connections
  Thread Stats   Avg      Stdev     Max   +/- Stdev
    Latency     9.86ms  717.96us  23.08ms   73.90%
    Req/Sec   509.57     12.08   540.00     76.67%
  15223 requests in 30.02s, 118.36MB read
Requests/sec:    507.03
Transfer/sec:      3.94MB
4 times faster response time and can handle more than 3 times more requests per seconds
With doubled connections and threads:
- cloudafrica: RPS 132.16 with average latency of 75.81ms
- rackzar: RPS 514 with average latency of 19ms
Importing data:
- cloudafrica: Took 705.52 seconds
- rackzar: Took 171.47 seconds
Locust response time test (10 simulated users):
locust --headless --host http://127.0.0.1:8000 -t 5m -u 10 -r 0.1
rackzar:
- mean response: 3ms
- RPS: 4.96
hostking:
- median response: 23ms
- RPS: 4.79
Locust load test (1000 simulated users):
locust --headless --host http://127.0.0.1:8000 -t 5m -u 1000 -r 1 --html load_test.html
rackzar:
- median response: 3ms
- RPS: 85.81
Locust load test (10000 simulated users):
locust --headless --host http://127.0.0.1:8000 -t 5m -u 10000 -r 5 --html load_test_2.html
- median response: 3ms
- RPS: 347.40
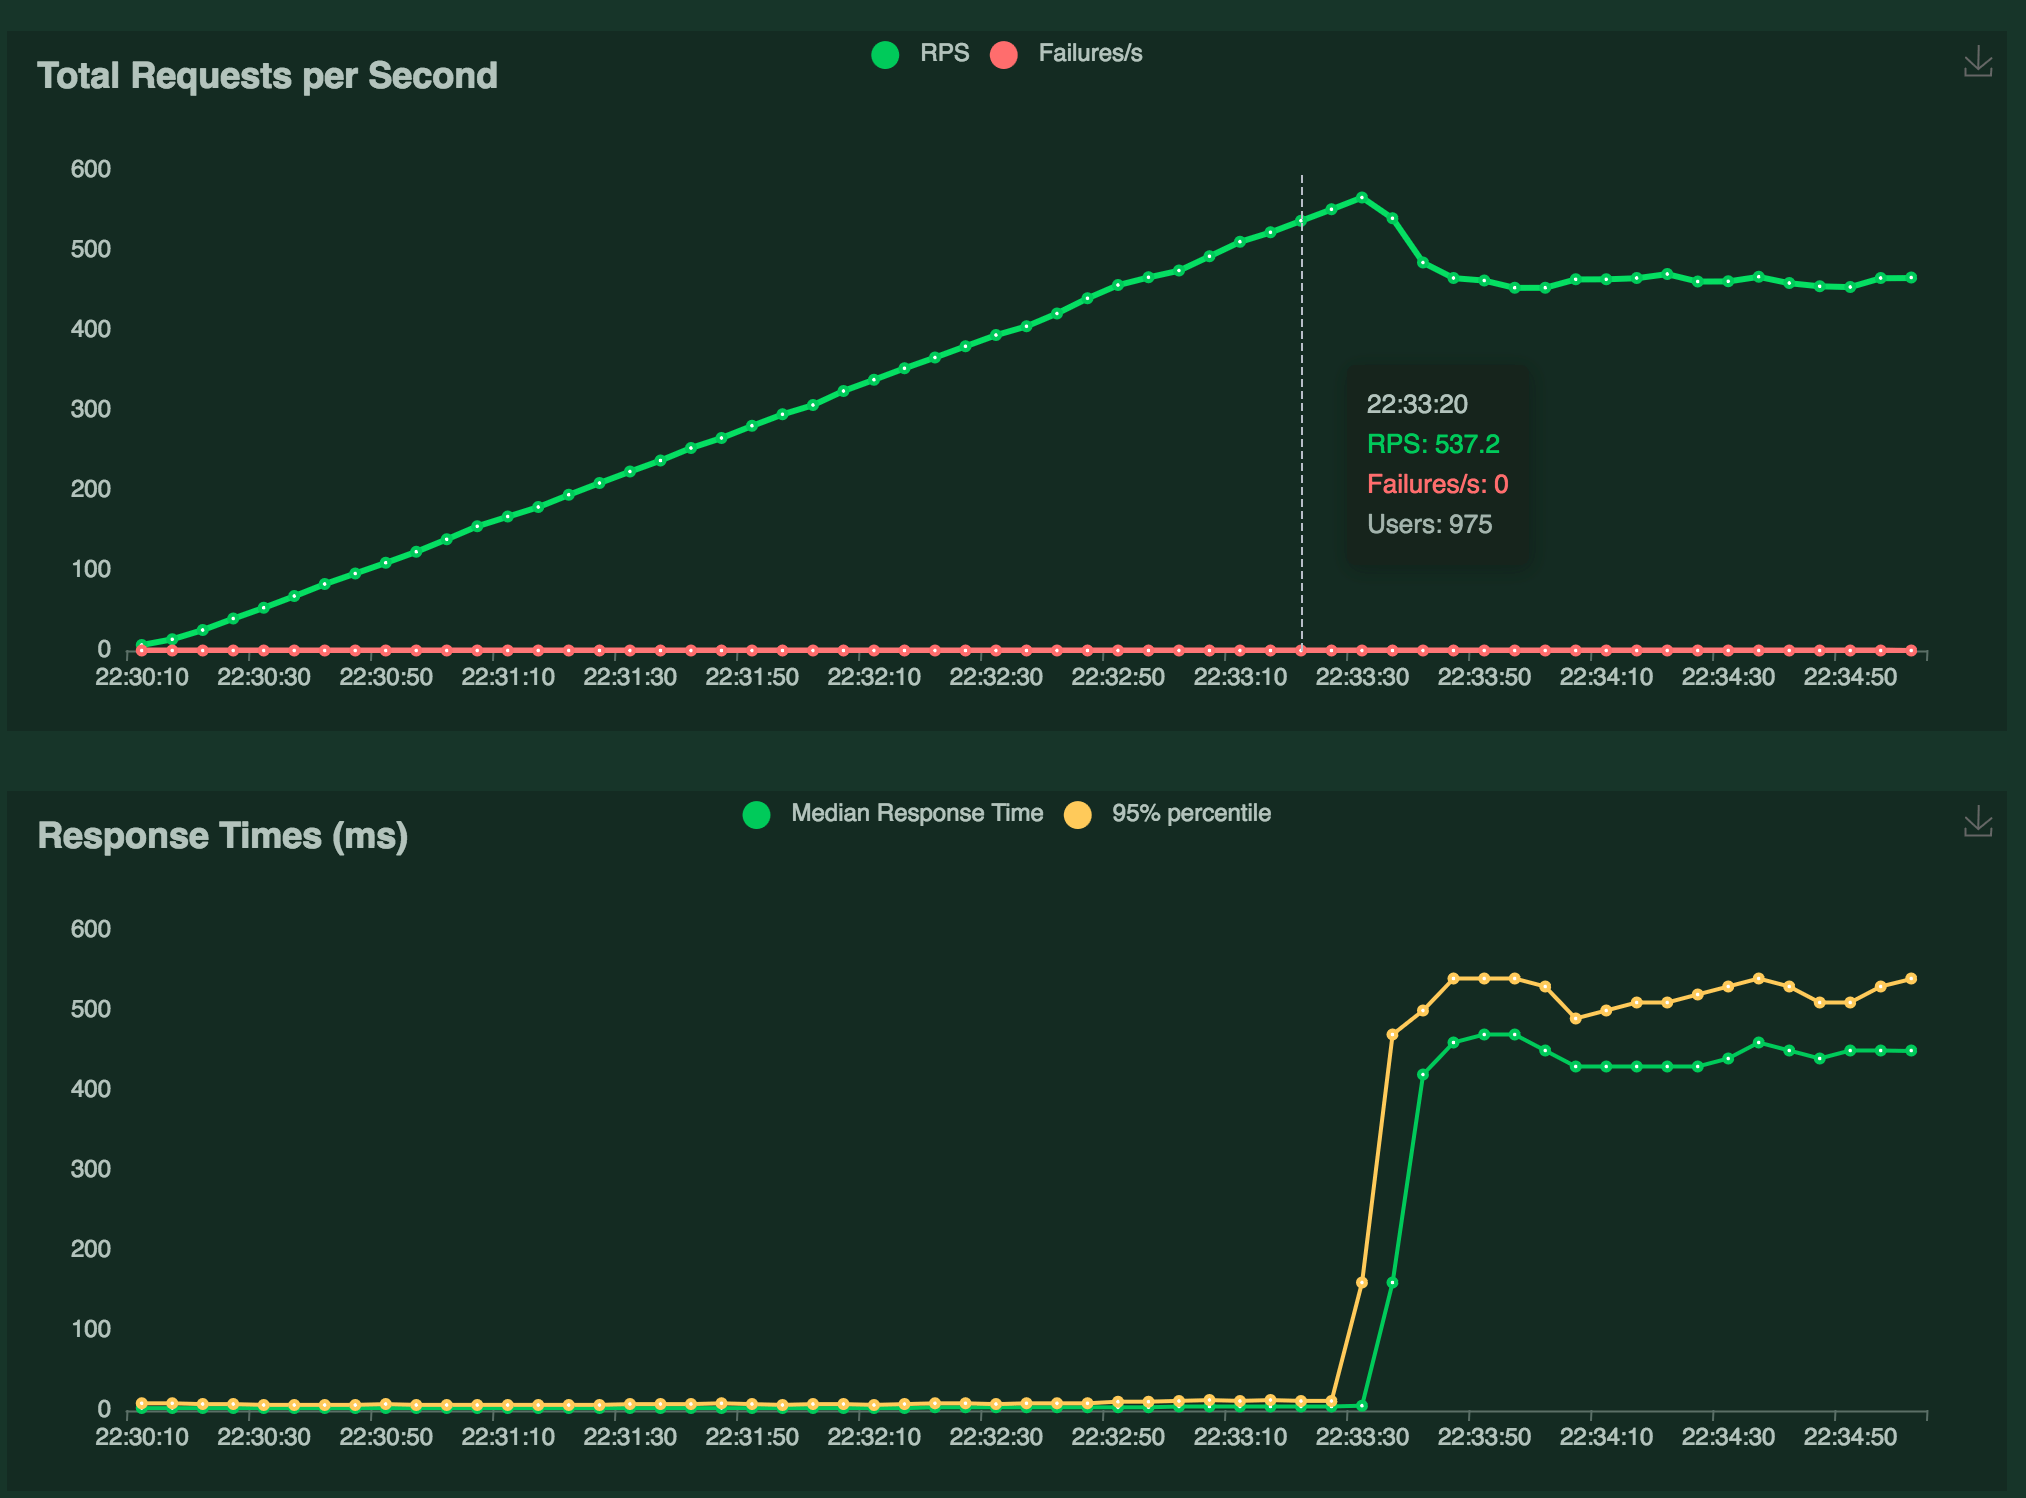
In this case the site could handle around 500 Requests per second with around 1000 simulated users before a degradation in performance was seen. The load tester was running on the same machine so perhaps also impacting the results.
Hostking:
- median: 4600 ms
- RPS: 107.26
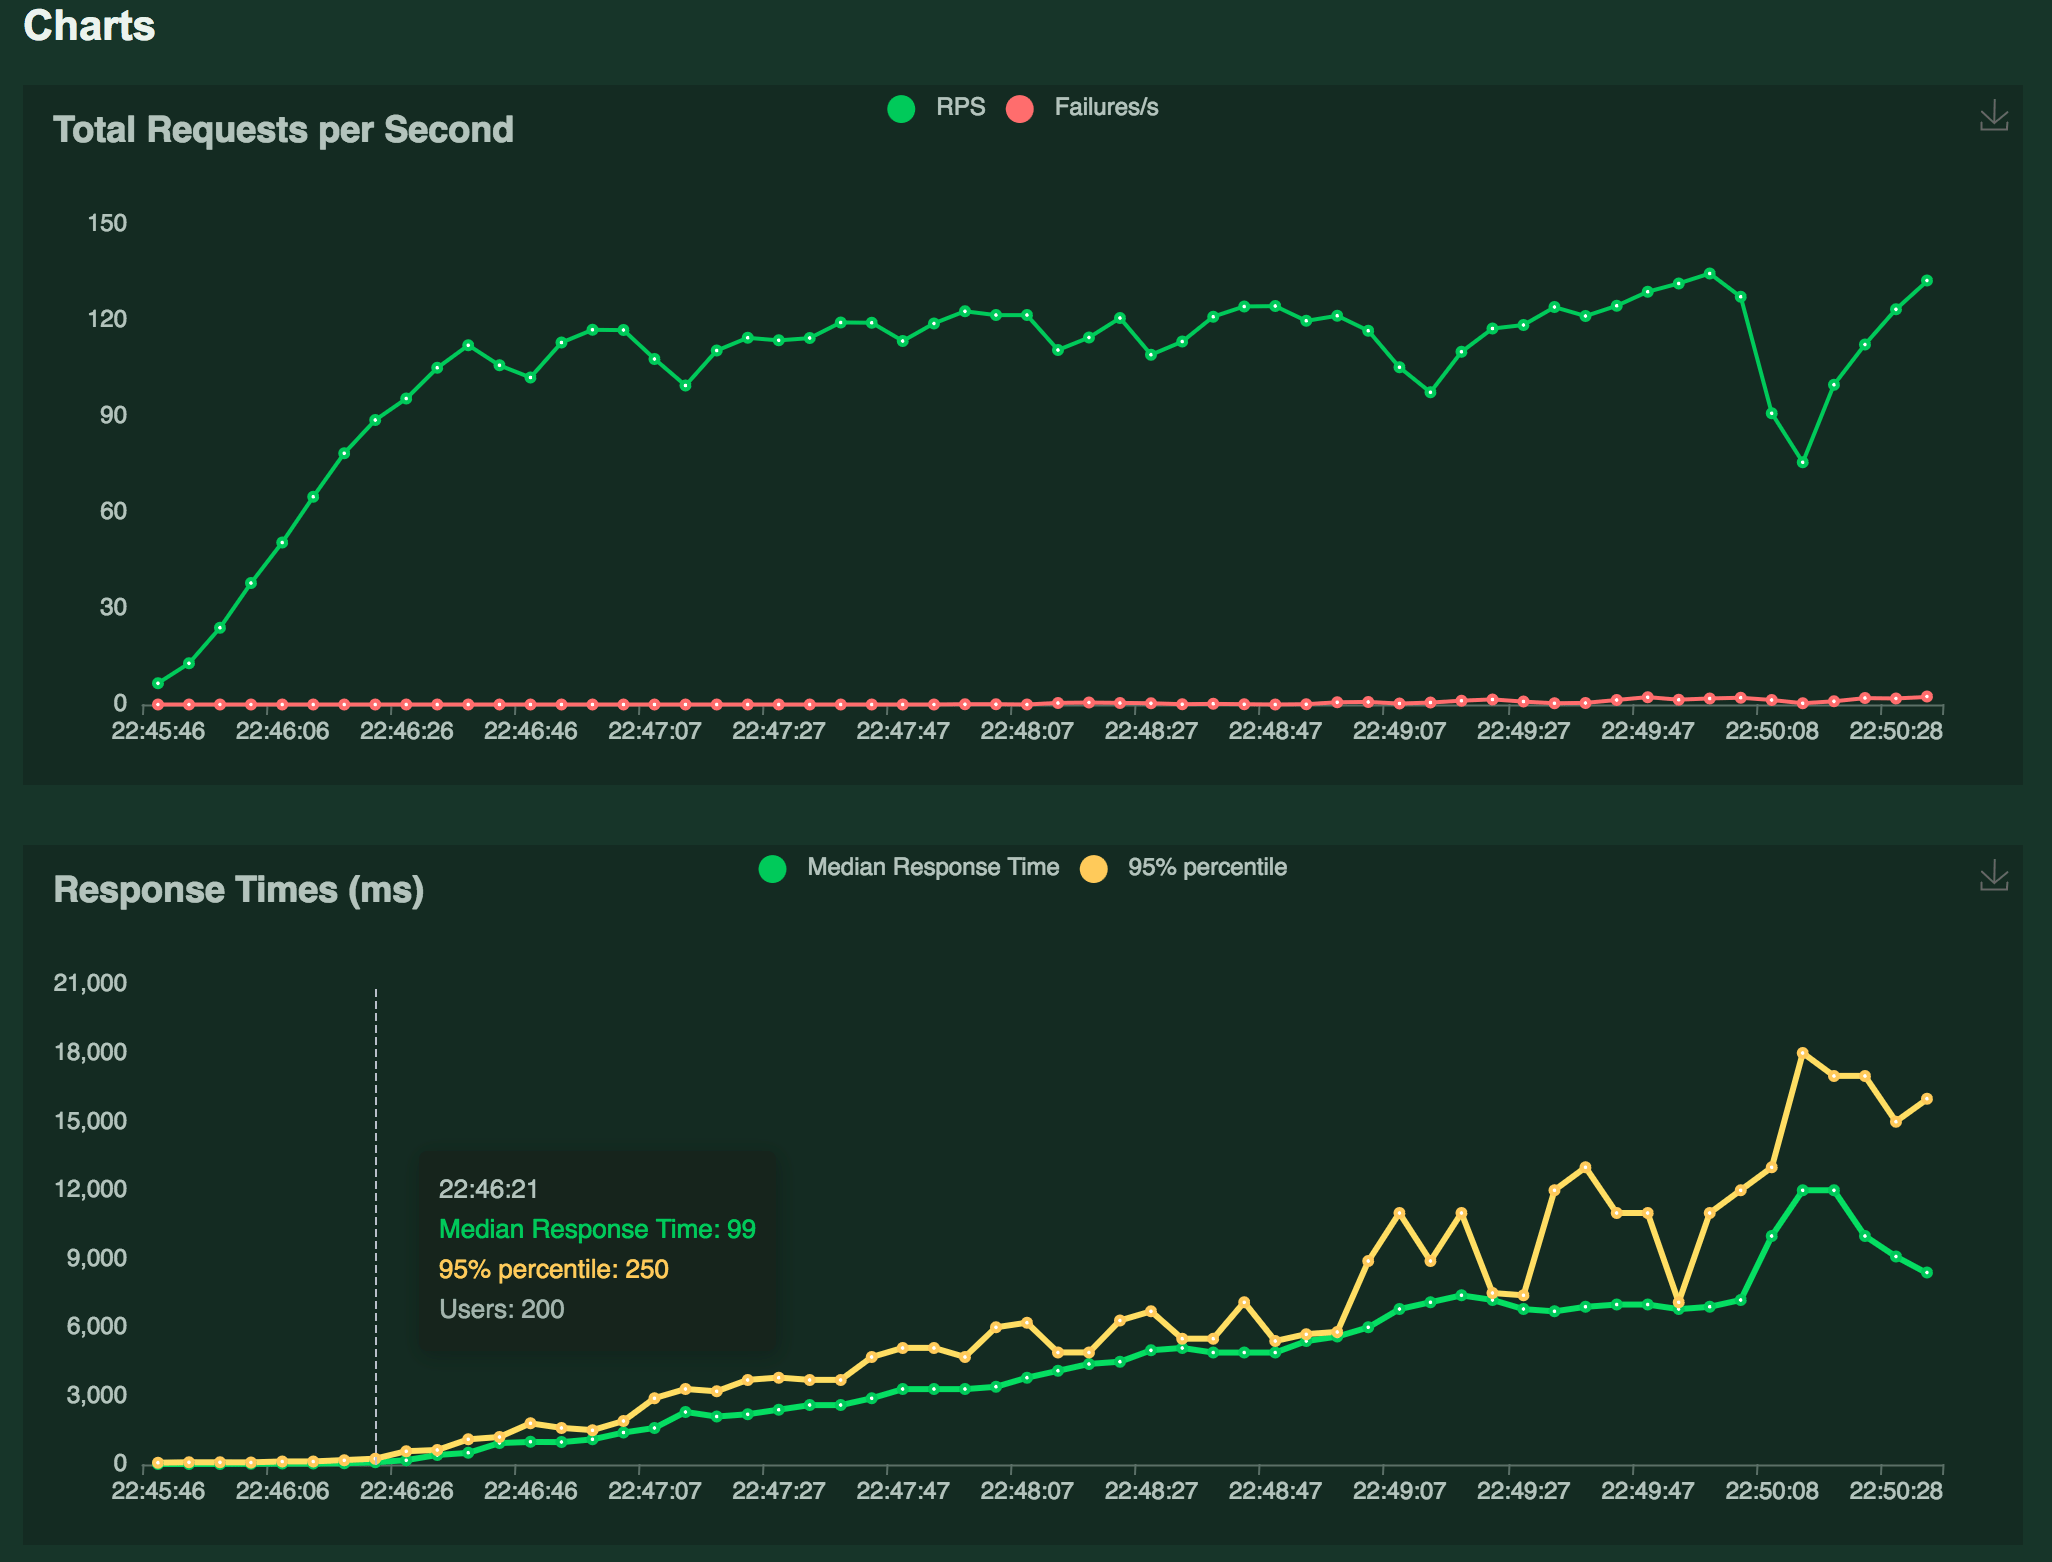
After reaching the 100 RPS (200 users) a marked incremental increase in response time was noted.
Networking Performance
Rackzar make use of Africa Data Centres Samrand (Jhb/Pretoria) and Cape Town.
Ping tests
It was noted that the ping latency is slower than that of hostkings at the time of the test.
Rackzar
root@rackzar:~/performance-testing/reports# ping 1.1.1.1
PING 1.1.1.1 (1.1.1.1) 56(84) bytes of data.
64 bytes from 1.1.1.1: icmp_seq=1 ttl=57 time=3.25 ms
64 bytes from 1.1.1.1: icmp_seq=2 ttl=57 time=3.48 ms
64 bytes from 1.1.1.1: icmp_seq=3 ttl=57 time=4.22 ms
64 bytes from 1.1.1.1: icmp_seq=4 ttl=57 time=3.11 ms

4 packets transmitted, 4 received, 0% packet loss, time 3004ms
rtt min/avg/max/mdev = 3.111/3.511/4.215/0.426 ms
(env) root@rackzar:~/performance-testing/reports# ping 8.8.8.8
PING 8.8.8.8 (8.8.8.8) 56(84) bytes of data.
64 bytes from 8.8.8.8: icmp_seq=1 ttl=57 time=20.7 ms
64 bytes from 8.8.8.8: icmp_seq=2 ttl=57 time=20.6 ms
64 bytes from 8.8.8.8: icmp_seq=3 ttl=57 time=20.6 ms
--- 8.8.8.8 ping statistics ---
3 packets transmitted, 3 received, 0% packet loss, time 2003ms
rtt min/avg/max/mdev = 20.591/20.623/20.681/0.040 ms
root@rackzar:~# ping ec2.af-south-1.amazonaws.com
PING ec2.af-south-1.amazonaws.com (99.78.132.94) 56(84) bytes of data.
64 bytes from 99.78.132.94 (99.78.132.94): icmp_seq=1 ttl=243 time=20.3 ms
64 bytes from 99.78.132.94 (99.78.132.94): icmp_seq=2 ttl=243 time=20.2 ms
--- ec2.af-south-1.amazonaws.com ping statistics ---
7 packets transmitted, 7 received, 0% packet loss, time 6008ms
rtt min/avg/max/mdev = 20.213/20.347/20.511/0.103 ms
Hostking:
ubuntu@web:~$ ping 1.1.1.1
PING 1.1.1.1 (1.1.1.1) 56(84) bytes of data.
64 bytes from 1.1.1.1: icmp_seq=1 ttl=59 time=1.59 ms
64 bytes from 1.1.1.1: icmp_seq=2 ttl=59 time=1.24 ms
64 bytes from 1.1.1.1: icmp_seq=3 ttl=59 time=1.29 ms
--- 1.1.1.1 ping statistics ---
3 packets transmitted, 3 received, 0% packet loss, time 2003ms
rtt min/avg/max/mdev = 1.240/1.373/1.589/0.154 ms
ubuntu@web:~$ ping 8.8.8.8
PING 8.8.8.8 (8.8.8.8) 56(84) bytes of data.
64 bytes from 8.8.8.8: icmp_seq=1 ttl=60 time=1.81 ms
64 bytes from 8.8.8.8: icmp_seq=2 ttl=60 time=1.77 ms
64 bytes from 8.8.8.8: icmp_seq=3 ttl=60 time=1.73 ms
--- 8.8.8.8 ping statistics ---
3 packets transmitted, 3 received, 0% packet loss, time 2004ms
rtt min/avg/max/mdev = 1.728/1.769/1.806/0.031 ms
PING ec2.af-south-1.amazonaws.com (99.78.128.100) 56(84) bytes of data.
64 bytes from 99.78.128.100 (99.78.128.100): icmp_seq=1 ttl=241 time=17.3 ms
64 bytes from 99.78.128.100 (99.78.128.100): icmp_seq=2 ttl=241 time=17.2 ms
64 bytes from 99.78.128.100 (99.78.128.100): icmp_seq=3 ttl=241 time=17.2 ms
--- ec2.af-south-1.amazonaws.com ping statistics ---
7 packets transmitted, 7 received, 0% packet loss, time 6009ms
rtt min/avg/max/mdev = 17.040/17.176/17.331/0.084 ms
Could be to do with the test being run on a VPS in rackzar’s CPT datacentre while the hostking ping is done in JHB. However – an aws cape town host was pinged and surprisingly the jhb server got a quicker response.
Latency to 1.1.1.1 was 2 x slower that hostking.
Latency to 8.8.8.8 was 11 x slower than hostking.
Latency to ec2.af-south-1.amazonaws.com was 1.18 x slower than hostking.
Speedtest
The speedtest-cli tool listed jhb servers as closest for the rackzar VPS:
(env) root@rackzar:~# speedtest-cli --list
Retrieving speedtest.net configuration...
12069) Megasurf (Vanderbijlpark, South Africa) [6473.22 km]
20934) Vaal Networking (Vanderbijlpark, South Africa) [6473.22 km]
49154) Openserve (Bloemfontein, South Africa) [6477.46 km]
 1620) Cell C (Johannesburg, South Africa) [6480.50 km]
 1440) Vodacom (Johannesburg, South Africa) [6480.50 km]
 2990) MTN SA (Johannesburg, South Africa) [6480.50 km]
23109) Reflex Solutions (Johannesburg, South Africa) [6480.50 km]
 6688) Network Platforms (Pty) Ltd (Johannesburg, South Africa) [6480.50 km]
54494) MWEB (Johannesburg, South Africa) [6480.50 km]
56654) INFINITY (Rustenburg, South Africa) [6579.56 km]
Rackzar speedtest:
root@rackzar:~# speedtest-cli --simple
Ping: 30.358 ms
Download: 603.66 Mbit/s
Upload: 343.58 Mbit/s
Hostking speedtest:
speedtest-cli --simple
Ping: 3.303 ms
Download: 909.37 Mbit/s
Upload: 725.75 Mbit/s
Bandwidth looking correct for 1Gbit. Latency numbers are strange.
Conclusion
Overall the Rackzar AMD Ryzen NVMe VPS offers superior performance compared to competitors. At least double as good performance wise for CPU based tasks but up to 40 times and better in some cases.
The price of the Rackzar AMD Ryzen VPS is R299/month at time of publishing. This is a good price point and if looking for bang for buck on CPU bound performance – it will deliver.
Sources
![]()